Browser-Based Load Testing vs. JMeter: When Real Browsers Are Worth the Cost

Quick Answer
Browser-based load testing (also called real-browser load testing) drives real browser sessions through your critical user journeys under load, so you measure whether users can actually finish the job, not just whether the server returned a 200. The easiest way I can explain why that matters: the test fails when the user would have failed, not only when the server does. This becomes really important if your application does lots of client-side rendering, authentication, redirects, dynamic pages, or interactive flows that create risks that a protocol-only test never touches.
Don’t get me wrong, protocol-level testing still has a real place. If you just want quick, cheap, high-volume HTTP or API throughput, this approach wins on cost.
But it’s not either/or.
Most mature teams I speak with on my podcast use both, matched to the risk each one is good at exposing.
How Many Concurrent Users Do You Actually Need? (The Biggest Mistake Isn’t Tooling)
Let’s start with this.
Just because a dashboard shows 10,000 visits in an hour does not mean your load test needs 10,000 concurrent users.
I wrote a post named what are concurrent users about this twelve years ago. It was my top-ranking page for years.
The funny thing is that when I sat down with the LoadView team recently, the first thing Denis brought up when I asked what people get wrong was exactly this. He walks their customers through building tests, so he watches it happen on repeat.
Somebody asks for a 10,000 concurrent user test. He asks where the number came from. They open Google Analytics and point at their busiest hour.
Nothing has changed!
Oh, before we get into it here is a quick rundown of who I talked to to prepare this article.
First, LoadView is a cloud load testing platform that runs both real-browser tests and protocol-level tests (HTTP/API, Postman, JMeter), and they sponsored this guide. So I spent two hours with Vadim Mazo, the founder, and Denis Parmon, a LoadView Performance Engineer, who ran a live demo and took every question I threw at him.
I asked what people get wrong before I asked about a single feature.
And most of what follows came out of that.
Because getting the concurrent user/transaction-per-second numbers wrong hurts both ways.
Too high and you buy a giant test that tells you nothing. Too low and you declare victory on a run that never stresses anything.
So this guide covers the whole performance lifecycle.
From picking the right test level, turning your analytics into a defensible workload, running it so the results mean something, and reading a failure without guessing.
And to be upfront, LoadView shows up as the implementation example because they’re the sponsor and because I just spent two hours on their product.
But don’t worry because if the honest answer is “use something else,” I say so.
Try it yourself: no credit card, no contract, up to 5 free tests.
What Is Browser-Based Load Testing?
As I mentioned at the start browser-based load testing runs your test through real browsers instead of replaying raw HTTP calls.
For example, you script what a user does in a typical business workflow.
Go to this page. Type the username. Click login. Add to cart. Check out. The browser handles everything underneath.
That last part is the whole point.
As Vadim put it to me:
“Because you run a full browser, the JavaScript engine inside the browser takes care of all the logic and massages the HTTP calls for you.”
Translation for anyone who has spent two days fighting a JMeter script: correlation goes away.
Session tokens, bearer tokens, SSO handshakes, AJAX chatter. Not “gets easier.” Goes away.
Believe me, correlation was the worst part of my job when I was a performance engineer.
Two days building the script, one afternoon actually running the test. Watching a browser just do that work on its own was mildly infuriating.
Denis said the pushback about this browser-based load testing approach almost always comes from people arriving off JMeter.
They always end up asking things like: How do you emulate logins for different users? Or how do you attach the bearer token to every request?
It takes a while for it to sink in that the whole point is that the browser already did it, so there’s no need to handle it at a lower protocol level.
He described their system as sitting on top of the browser and telling it what to do, and everything below that line is the browser’s problem.
This does not mean the browser is a magic solution for everything.
What this is not: a replacement for every protocol level test. It’s a different layer of fidelity and it costs more per virtual user. Anyone who tells you browser tests are universally more accurate is selling you something.
Can JMeter Be Used for UI Performance Testing? Where It Fits and Where It Goes Blind
Since JMeter is in the title, let me be specific about it, because I still like the tool.
JMeter is great at what it was built for: cheap, high-volume HTTP and API load. If your risk is “can the API tier take the request volume,” JMeter is a fine answer and I’d say so to anyone.
What JMeter can’t see is anything that happens after the response comes back. It doesn’t execute JavaScript. So it never renders the page, never runs the SPA router, never fires the XHR calls the framework would have fired, and never notices that a 200 OK came back with an error message in the body that the UI then showed the user. Every one of those is a user-visible failure that reads as “passed” in a JMeter report.
That’s not a knock on JMeter. It’s just the layer it works at.
And you don’t have to throw JMeter away to move up a layer. LoadView runs your existing .jmx scripts in their cloud as protocol tests. So if you’re a JMeter shop, the plan I’d suggest is: keep JMeter for the volume, add a small real-browser cohort for the journeys that actually matter, and run both from the same place so the results land in one report.
Browser-Based vs Protocol Level: Choose by Risk, Not Ideology
It comes down to picking the test level that can expose the failure you’re trying to prevent.
So choose browser sessions when the risk is a broken or slow user journey. Go with protocol level traffic when the risk is raw request or API throughput.
Or if you want to get crazy, both when both are real.
Here’s a decision table to help you:
| Decision factor | Browser-based test | HTTP / protocol level test |
|---|---|---|
| Main fidelity | Visible user flow, client side execution, rendering | Requests, responses, throughput, service behavior |
| Scripting burden | Low for UI flows. Record the path and go | High. Request modeling, correlation, parameterization |
| Scale economics | Higher cost per session. Browsers are heavy | Far cheaper at very large request volumes |
| Best fit | SPA, SSO, checkout, reporting, streaming, file upload | APIs, backend services, very high volume endpoints |
| Primary evidence | Validation steps, action timing, session video, waterfalls | Latency, throughput, error rate, server metrics |
Neither one replaces observability. You still need logs, traces, and APM to find the root cause.
Denis drew the practical line at roughly 1,000 concurrent users, and to be clear, that is not a ceiling on what LoadView will run. It’s the point where the economics flip for a simple flow.
Under that, you’ll burn more hours emulating the flow through HTTP than you’ll ever save on infrastructure. The run costs more, and you’re done in an afternoon instead of next week. Above that, for simple flows, HTTP is still the right answer, and he said so without being asked. For complex journeys, customers run browser tests well past that number; the question is whether the journey needs a browser, not how big the test is.
What I thought was really cool about LoadView was the ability to reuse the functional test you might already have to start your performance testing journey.
So before you throw away existing assets, be aware that LoadView can run your Postman collections, JMeter scripts, and Selenium IDE scripts in their cloud, and you can launch them alongside real-browser tests in one run. That makes the hybrid setup I keep recommending in this article one platform and one report, not two tools and a spreadsheet.
Playwright support was described to me as in beta and close. Check their current docs for where that landed before you plan around it.
For everything else there is the EveryStep Recorder, a point-and-click recorder that captures the journey as you click through it. That’s the “record the path and go” in the table above.
Try it yourself: no credit card, no contract, up to 5 free tests.
Start With the Workload, Not the Headline Traffic Number
Another thing to keep in mind is that visitors, sessions, arrivals, and concurrent users are related BUT they are not interchangeable.
The one that trips people up most is concurrent users versus total users. Total users (or total sessions) is how many journeys ran over the whole test window. Concurrent users is how many are active at the same instant. A 50-user test running a one-minute script for 10 minutes is 50 concurrent users and roughly 500 total users, and it’s the 50 that sizes your test. The LoadView team told me this is where their customers get confused most often, so they made a 46-second video on it: Concurrent Users vs. Total Users Explained. Worth the minute before you touch a load curve.
So, here are five things every workload model needs:
- a time interval
- a journey duration
- an arrival pattern
- a behavior mix
- and the actual actions that generate load
Next let’s look at the best way to estimate the starting concurrency of your test.
How to Calculate Concurrent Users From Google Analytics
This is easy because LoadView already has published a calculation for this:
Estimated concurrent users = sessions per hour × average session duration in minutes ÷ 60
Work it through:
| Input | Example assumption |
|---|---|
| Peak hourly sessions | 1,200 |
| Average session duration | 3 minutes |
| Estimated concurrent users | 60 |
Twelve hundred sessions an hour. Sixty concurrent users.
This is a number that tends to surprise most testers since it tends to be much smaller than what you came up with before this exercise.
To me, this is a good place to start, but not the main source of truth for how much traffic your system can handle.
After that, break the numbers down by channel, location, or device only when those differences affect how people use the application. Then compare your assumptions with your actual traffic data.
Arrivals or Concurrency? Pick the Model That Matches Production
How do you want to design your performance scenarios?
There are two ways to model a workload, and they answer different questions.
Open model: new users keep arriving on a schedule regardless of what’s happening to the people already in the system. If your app slows down, arrivals keep coming and the population grows. This matches most public traffic. Marketing sends the email whether or not your checkout is struggling.
Closed model: a fixed population of active users, each finishing a journey before starting the next. If the app slows down, throughput drops but the user count stays put. This matches internal systems and captive user bases better.
Get this backwards and your test will mislead you in a specific way.
Closed models hide the death spiral, because slowdown automatically throttles the load. Open models expose it.
In my experience if you’re testing a public launch or a promotion, you almost certainly want arrivals.
In LoadView terms, this is the choice of load curve.
A Load Step curve is the closed model: you set a number of concurrent users and ramp it. A Goal-Based curve is the open model: you set a target transaction rate (the visitors you expect in a given interval) and LoadView adds users until the system is receiving that arrival rate, whatever happens to response times. There is also a Dynamic Adjustable curve that lets you change the load by hand while the test is running, which is handy when you want to push past the plateau and see where it breaks.
Model a Realistic Journey Mix
Another thing I’ve learned is that one enormous action almost never represents how a business actually operates.
This also came up in my conversation with the LoadView folks.
Denis’s example was e-commerce: a small subset purchasing and a much larger subset browsing and searching, which is where the base load actually lives.
Illustrative only. Replace every percentage with your own analytics:
| Journey | Illustrative share | Critical success signal |
|---|---|---|
| Browse / search | 65% | Results render and stay responsive |
| Product detail | 20% | Page renders, price and inventory validate |
| Add to cart | 10% | Cart action completes and state persists |
| Checkout | 5% | Checkpoint completes within the agreed threshold |
In LoadView you build these as separate tests and launch them together as a group test. Denis said customers regularly run 20 to 30 at once for complex apps with multiple roles, and there’s no hard limit.
Roles matter here too.
Their telemedicine customer needed patients and doctors as two separate scripts that had to interact. A webinar needs a host and viewers. Buyer and admin. Test the system, not a single persona.
How Many Browsers Can One Load Generator Run? The Part Nobody Warns You About
Got to be upfront with you: there are situations where, if not done right, browser-based load testing can become an infrastructure problem.
Vadim told me a good size server runs somewhere between 8 and 12 browsers.
For example he said a simple application might scale to 12 per machine, while a media site heavy with video and JavaScript might only give you 3 or 4.
LoadView’s own sizing guide backs that up: the default is 8 real-browser users per load injector (8 cores, 16 GB), versus 500 users for an HTTP test on the same box. That roughly 60-to-1 ratio is the whole cost argument in one number.
Treat it as a planning reality check, not a benchmark to quote in a capacity doc.
Now let’s do the arithmetic.
A thousand browsers need roughly a hundred servers. Ten thousand needs a thousand. Very few companies have that lying around, and standing up an in-house lab to do this is a nightmare and takes time away from what you want to do, testing.
But there is a better way.
LoadView orchestrates the cloud side against AWS and Azure, spins the browsers, runs your script, and hands you the reports. You pick regions from 40+ load injector zones across the US, Canada, South America, Europe and APAC, which matters if you’re a German company with a German audience and no reason to hammer yourself from Singapore.
If you’d rather not use their cloud, you can deploy their load injectors inside your own network or your own AWS or Azure account, which is how the government agencies and the teams with big cloud discounts run it.
Heads-up there’s a related trap on the other side of this.
If you cram too many browsers onto a machine, your load generator becomes the bottleneck and you end up reporting on your own infrastructure.
Vadim’s guidance: don’t leave injectors sitting at 5% because you’re wasting money, and don’t push past 80% because the numbers stop meaning anything.
A Seven Step Plan for a Test Worth Running
- State the business outcome and the non negotiable journey. In business terms. “A learner signs in and starts a webinar.” “A shopper completes the checkout.” Not “the app is fast.”
- Pick two or three critical flows and assign a realistic mix. Denis put this bluntly: customers ask to test every button and every action, and that’s the wrong instinct. On an e-commerce site nobody’s quarter dies because the wish list is slow. It dies at cart, checkout, and confirmation. Everything else belongs in functional testing.
- Prepare authorized identities and safe data. Unique accounts, safe test data, and a plan for authentication. Watch for shared state problems: two virtual users on the same account can end up fighting over one shopping cart, and one of them “completes” a purchase while the other sits with an empty basket. LoadView handles this with a Row Use setting on your uploaded CSV: Not Unique (random rows, the default), Unique per User (each virtual user gets its own row, for apps that don’t allow concurrent login), or Unique per Session (every run gets a fresh row, so registrations and unique IDs never collide).
- Define user visible validation and thresholds. Assert on the screen state that proves the job finished, not just a status code. Set thresholds on end-to-end action timing, error rate, and business completion.
- Run a low load baseline first. One user. Prove the script works and capture what normal looks like. This is the step everyone skips, and it’s the one that makes every later number interpretable. As Vadim put it, load testing is about relative numbers, not absolute ones. If a journey takes 3 seconds at one user and still takes 3 seconds at 10,000, you’re fine. If it goes to 60 seconds at 1,000, now you have a business decision to make.
- Ramp, hold, then watch recovery. A controlled ramp, a stable plateau, a controlled ramp down. Escalate only after the previous stage gave you something you could read. Improvised rollercoaster patterns produce findings nobody can isolate.
- Correlate with application and infrastructure evidence. Tag your test traffic so your APM can find it, then line up the degradation window with logs, traces, and metrics.
On that last point, LoadView deliberately doesn’t ingest APM data into its own reports, and Vadim was upfront about why.
There’s Dynatrace, New Relic, Datadog, and every cloud provider’s own tooling, and chasing all of them is somebody else’s business. Instead, every request LoadView sends already carries a marker in the User-Agent header (DMBrowser/2.1 (UV; LV) for browser tests, (SV; LV) for protocol tests), and you can add a custom user agent string or header on top of that so your APM can isolate the traffic. Then you run both screens side by side and export their data to overlay in your tool.
Not the answer I expected. It’s the honest one.
Before You Press Run
| Check | The question you have to answer |
|---|---|
| Authorization | Who approved the target, the window, the expected impact, and the stop condition? |
| Scope | Which journeys and dependencies are deliberately in or out? |
| Workload | What traffic data, duration, pace, mix, and regions justify the load you chose? |
| Test data | Are accounts, IDs, files, and any 2FA or SSO arrangements safe and unique? |
| Success criteria | What user visible behavior, latency, error rate, and recovery define success? |
| Observability | Where will logs, traces, APM views, and infrastructure metrics be watched, and by whom? |
| Safety | What’s the abort threshold and who has the authority to kill the run? |
The one that gets skipped is Safety.
Decide who can stop the test before you start it, not while your production checkout is on fire.
How to Diagnose a Failed Load Test Without Guessing
Do not start with a single average response time chart.
Compare the baseline against the loaded run, find the first user visible step that degrades, inspect the session and waterfall evidence for that step, then correlate the exact timestamp with your logs and traces.
Denis’s specific advice was to open two waterfalls side by side, the one user validation run and the loaded run, and ask which step got longer first. Then open that step and ask whether specific endpoints blew up or everything just got slightly worse. Those are different problems with different fixes.
Then separate the symptom from the conclusion:
| What the test shows | What it may indicate | Evidence to inspect next | What NOT to assume |
|---|---|---|---|
| A request is slow | Backend, dependency, network, or client side sequencing | Waterfall, trace, dependency metrics | That this request is the root cause |
| HTTP 429 or 5xx | Rate limiting, capacity, or an application error | Response detail, timestamp, logs, rate limit config | That every user saw the same thing |
| UI shows an error, requests all succeeded | Client side logic, content in the response body, validation, rendering | Session video, console output, validation state | That HTTP 200 equals a successful experience |
| Generator CPU or memory is pinned | Your test infrastructure is the bottleneck | Injector CPU and memory, browsers per machine, run design | That the target application failed |
That third row is the one browser-based testing exists for and the part of the demo I saw that really gave me a WOW moment.
Every session gets recorded on video, synchronized to the waterfall chart.
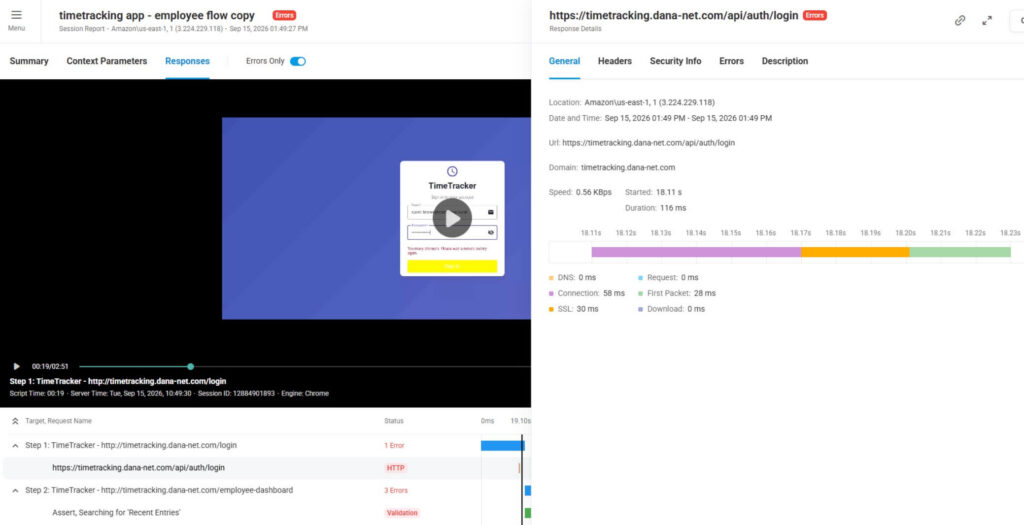
Click an error on the waterfall and the video scrolls to that exact moment. Denis pulled up a run where the waterfall showed a 429 and the video showed the UI saying “too many attempts, please wait a minute and try again.”
Here’s why that matters more than it sounds.
On modern front ends, a huge share of failures come back as 200 OK with the error sitting in the response body, and the UI renders it. Your HTTP test says everything passed. The video says otherwise. Denis said customers hit this constantly: no HTTP errors, test “clean,” app clearly broken. Videos are kept for 15 days and you can download them.
Half the arguments I had with developers in my GE Healthcare days were over whether an error was real. A recording ends that conversation in about nine seconds.
To be exact about what this buys you: faster investigation. It does not prove the application root cause on its own. You still need the logs and traces, and Denis noted that in production you’ll almost never see a stack trace come back through the browser because that’s the first thing teams disable. Timestamp correlation is usually the only bridge you have.
This is a long article and still no mention of AI?
No worries because we are about to get into it.
Where AI Helps and Where It Doesn’t: LoadView’s AI Assistant
When I finally asked about AI in performance testing they told me that LoadView has an AI Assist feature in beta.
It works by pulling the results of a selected test, sends them to OpenAI, and lets you ask questions about them.
Three prompts worth trying:
- Which step in the user flow had the largest response time increase after the ramp began?
- What error type appears most often, and which journey step does it concentrate in?
- Did the generator CPU or memory suggest the run was constrained by the load infrastructure rather than the application?
Data and accuracy note. It’s beta. It requires account level enablement, and an admin can turn it off entirely, which is the right call for plenty of enterprise shops. It analyzes the data in the selected report, not your logs, your traces, or your code. Large tests can take 5 to 10 minutes to process before you can ask anything. And no, you can’t point it at a local model. I asked about Ollama. They use OpenAI’s APIs.
Denis was straight about the limits: you can’t rely on it 100%.
It’s good at spotting patterns and giving a non specialist somewhere to start. Vadim’s example of it working well was identifying a Facebook pixel getting rate limited and telling the user not to worry about it. It cannot see inside your stack, so it can’t tell you whether that spike was the database or the application. When it makes a claim, make it show you where in the data it’s seeing that.
Where it earns its keep is the handoff.
A lot of the people running these tests sit in QA or marketing and have no idea where to start reading a load test report. Getting them to “here’s what we ran, here’s what got flagged, what do you think?” is a real improvement over a report nobody opens.
I also asked whether people are load testing AI features themselves.
Vadim’s answer was refreshingly blunt: if you’re hitting a public frontier model you pay per token, so every request your load test sends is a real bill. It’s like load testing a checkout page by actually buying something on every run, with your own credit card.
Testing an app that uses an LLM is a different story and they do plenty of it.
Denis described a customer whose system generated summary reports from tender documents. The script walked the flow, requested a report, and checked whether any expected section came back empty. Empty section, failed generation, at scale.
That’s a smart way to test something nondeterministic without pretending you can assert on the prose.
Use Cases Where the Effort Pays For Itself
Webinar or streaming platform. Sign in, authorization, player launch, sustained session. The value is in whether the viewer reaches the player and stays connected, which HTTP simply cannot tell you. This one’s personal: we built our own webinar system and I need to know 500 people can log in and stream at once. My developer is sharp and has zero interest in learning performance testing to find out.
E-commerce promotion. Browse, search, product detail, cart, and a smaller checkout cohort. The mix is the whole test. Treating every visitor as a checkout user models a business that doesn’t exist.
Enterprise SaaS and Salesforce style workflows. Login, report generation, dynamic forms, file upload. Denis recorded a Salesforce script that creates a customer, sets parameters, uploads files, and runs a report in under an hour. At the protocol level that’s close to impossible, because the HTTP layer shifts constantly and it’s all SPA and AJAX underneath.
Real time collaboration with camera and mic. Their telemedicine scenario had patients and doctors joining appointments and actually transmitting audio and video into the channel. There is no protocol level version of that test.
Authenticated flows with 2FA. If your authenticator setup exposes the TOTP secret, LoadView generates the six digit code on the fly rather than hardcoding it. Denis was honest about the prep though: every user needs its own secret, so you have to stage the accounts before test day. Not all 2FA implementations work this way.
About Testing Against Production
I asked where people actually run their performance tests nowadays.
Vadim’s estimate was that roughly 70% of their tests hit production.
Not going to lie that made me cringe a little until he explained it.
Replicating enough capacity in QA to make a large test meaningful often costs more than the test does. Their Super Bowl advertiser was tested against production because there was no realistic alternative.
Denis added the pattern he sees: teams test right before a launch, or they test after they’ve already had an outage. In the second case staging is useless to them, because staging isn’t what fell over.
If you go this way, it’s a decision, not a default. Pick the window. Tell ops and support. Tag the traffic. Watch out for real side effects like purchases, emails, and notifications. And set the abort threshold before you start.
So When Should You Use Browser-Based Load Testing?
In one sentence: use browser-based load testing when the risk is a user-visible journey, use protocol-level testing (JMeter, HTTP, API) when the risk is raw throughput, and use both when both are real.
| Use browser-based when… | Prefer protocol level when… | Go hybrid when… |
|---|---|---|
| The risk is user visible completion, rendering, or a complex transaction | The risk is extreme request or API throughput and browser behavior is out of scope | You need broad capacity validation and confidence in the end to end experience |
| The journey depends on SSO, SPA behavior, uploads, streaming, or third parties | You need cheap load at very large scale on simpler calls | A smaller browser cohort validates UX while protocol traffic creates the volume |
| You need evidence that explains what users actually saw | You mainly need transport and service metrics | You need to connect front end symptoms to back end telemetry |
The goal was never to generate the largest number of virtual users. The goal is a workload that can answer a business critical question with evidence you’d defend in a room full of engineers.
FAQ
What is browser-based load testing? Load testing that drives real browser sessions through critical user actions instead of replaying HTTP requests. Because the browser executes the client side code, you can validate what the user actually sees and completes. It doesn’t replace protocol level testing, it answers a different question.
Is browser-based load testing better than HTTP load testing? Neither is categorically better. Choose by risk. Browser sessions expose broken or slow user journeys. Protocol level traffic exposes throughput and API capacity limits at lower cost. Many teams run both.
What is LoadView? LoadView is a cloud-based load testing platform that runs tests in real browsers as well as at the protocol level (HTTP/API, Postman collections, JMeter scripts, Selenium IDE scripts). Tests run from 40+ cloud locations on AWS and Azure or from on-premise load injectors inside your own network.
Can I use my JMeter scripts with browser-based load testing? Yes, in the sense that you don’t have to pick. LoadView runs existing JMeter (.jmx) scripts as protocol-level tests in its cloud and lets you launch them alongside real-browser tests, so the JMeter script supplies the volume and a browser cohort checks the user experience in the same run.
How do I estimate concurrent users from web analytics? Sessions per hour × average session duration in minutes ÷ 60. Twelve hundred sessions an hour with a three minute average gives roughly 60 concurrent users. Treat it as an estimate and validate the assumptions against your own data before you build a test plan on it.
What’s the difference between concurrent users and sessions? Concurrent users are how many are active at the same moment. Sessions are how many times a journey ran end to end. A 50 user test with a one minute script held for 10 minutes generates about 500 sessions, which is why a small looking test can produce meaningful traffic. LoadView’s short video Concurrent Users vs. Total Users Explained covers this in under a minute.
How many browsers can one server run? The LoadView team’s figure is 8 to 12 for a typical application, dropping to 3 or 4 for heavy sites loaded with video and JavaScript. It varies with your application, so treat it as a planning reality check rather than a benchmark. It’s the reason large browser-based tests are impractical on your own hardware.
How do I load test a single page application? Test a real user journey rather than individual requests, assert on a rendered state that proves completion, run a one user baseline, ramp progressively, and inspect user visible errors alongside your telemetry. SPAs routinely return successful responses while the UI shows a failure.
Can I load test SSO, MFA, streaming, or file uploads? Often, but test it before committing to a large run. A browser can handle most SSO and dynamic login flows. TOTP authentication is also possible, as long as you have the secret for each virtual user. The same goes for streaming and file uploads, which generally need a browser. Authentication setups vary, though, so confirm that yours works with a small test first.
How should I investigate a load test failure? Run the journey once with a single user, then run it again under load. Look for the first point where the experience slows down or fails. The session recording and network waterfall should show what happened in the browser. Use the timestamp to find the matching logs, traces, and infrastructure metrics. One last check: make sure the load generator itself wasn’t maxed out before blaming the application.
Does LoadView have AI features? Yes. LoadView’s AI Assistant (in beta) analyzes a completed load test report and answers questions about it, such as which step degraded first or which error was most common. It must be enabled by an account administrator and works only on the report data, not your logs or code.
Can AI tell me the root cause of a failed load test? It can analyze the report data and suggest leads, which is genuinely useful if you don’t know where to start. It cannot see your logs, traces, or code, so it can’t distinguish a database problem from an application problem. Validate anything it tells you against telemetry.
Where I Landed
I came in expecting to be told browsers had magically become as cheap as HTTP. That’s not what I heard. Browsers cost more to run, and they said so twice without me pushing.
What you’re buying is your own time, plus evidence you can’t get any other way. If your app is anything close to modern, the correlation work you skip is worth more than the injector hours you spend. And if your critical journey involves a video player, a webinar, or a Salesforce screen, HTTP was never really on the table.
Start smaller than you think. Record one script against a critical journey, run it with one user, and look at the baseline. That’s the entire first step, and it’s the one people skip on their way to spending real money discovering their server dies at ten users.
So, should you use LoadView? If your critical journey runs in a browser, it’s where I’d start. Three things from what I saw: the recorder takes away the correlation work that ate most of my time back when I was doing this with JMeter; the video synced to the waterfall settles “was that error real” in seconds; and it runs the JMeter, Postman, and Selenium scripts you already have alongside the browser tests, so the hybrid approach in this article is one platform. If your risk is pure API throughput on simple calls, a protocol tool will do it cheaper, and Denis said as much himself.
Ready to validate a critical user journey?
LoadView handles real browser recording, configurable load curves, and the cloud orchestration so you’re not standing up a hundred servers yourself. Start with a small, authorized baseline test — the trial takes no credit card and no contract, and comes with up to 5 free tests.
Try it yourself: no credit card, no contract, up to 5 free tests.

Joe Colantonio is the founder of TestGuild, an industry-leading platform for automation testing and software testing tools. With over 25 years of hands-on experience, he has worked with top enterprise companies, helped develop early test automation tools and frameworks, and runs the largest online automation testing conference, Automation Guild.
Joe is also the author of Automation Awesomeness: 260 Actionable Affirmations To Improve Your QA & Automation Testing Skills and the host of the TestGuild podcast, which he has released weekly since 2014, making it the longest-running podcast dedicated to automation testing. Over the years, he has interviewed top thought leaders in DevOps, AI-driven test automation, and software quality, shaping the conversation in the industry.
With a reach of over 400,000 across his YouTube channel, LinkedIn, email list, and other social channels, Joe’s insights impact thousands of testers and engineers worldwide.
He has worked with some of the top companies in software testing and automation, including Tricentis, Keysight, Applitools, and BrowserStack, as sponsors and partners, helping them connect with the right audience in the automation testing space.
Follow him on LinkedIn or check out more at TestGuild.com.
Related Posts

HTTP is the protocol web browsers, mobile apps, and test tools use to request information from a server and receive […]

What is Throughput in Performance Testing? Throughput is the amount of work an application completes over a given period. In […]
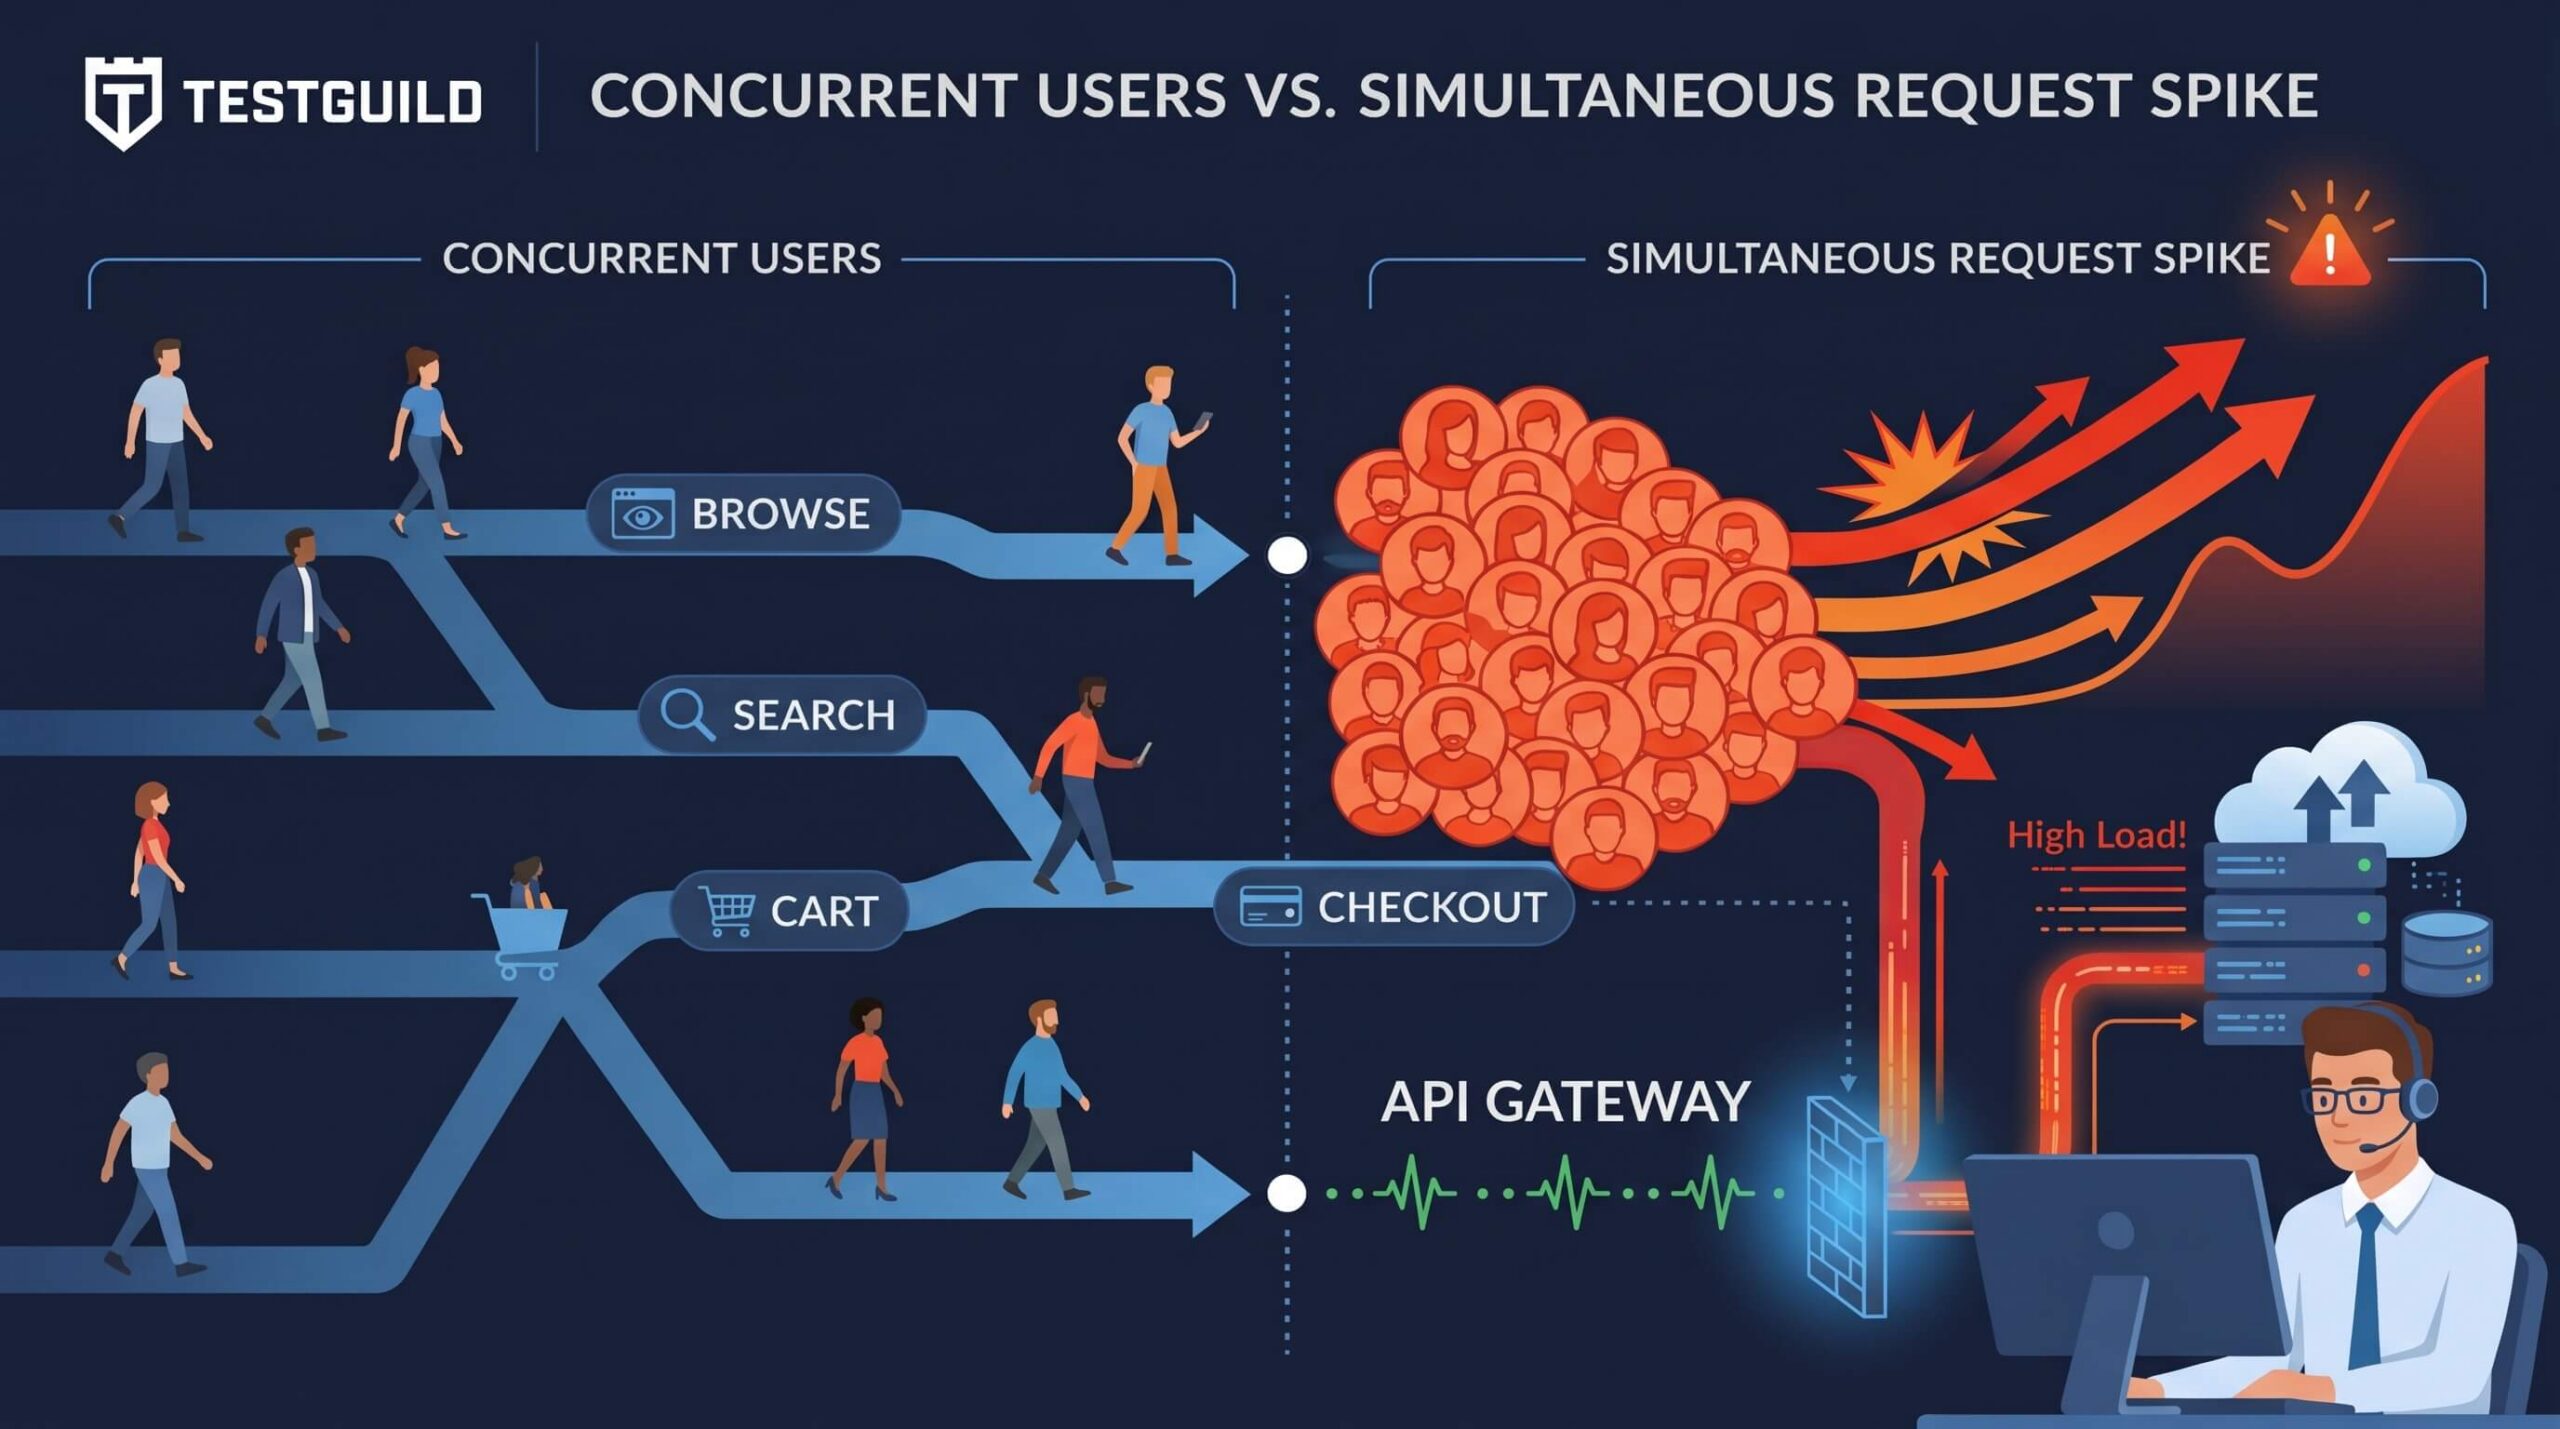
Concurrent users are the people or virtual users who are active in an application during the same time window. They […]

Disclosure: OctoPerf is a TestGuild sponsor. All opinions are my own. Here’s a pattern I’ve seen over and over again […]