What Is HTTP in Performance Testing?

HTTP is the protocol web browsers, mobile apps, and test tools use to request information from a server and receive a response. In performance testing, understanding HTTP helps you build realistic protocol-level scripts, interpret failures, and determine whether an application is fast, reliable, and handling the right workload.
You do not need to become an HTTP specification expert to be a good performance tester. But you do need to understand what your test is sending, what the server is returning, and what a status code, header, redirect, cookie, or slow request is trying to tell you.
This guide (originally published in 2011 updated in 2026) explains HTTP through a performance-testing lens: the request and response, the signals worth measuring, the status codes worth knowing, and when an HTTP-level test is enough versus when you need a real browser.
What do hens and HTTP have in common?
Several years ago, I was on a road trip with my wife and her parents. I was riding shotgun with my father-in-law, following my wife and mother-in-law in a separate car. At one point he looked at them talking back and forth and said, “Look at the two of them talking. They look like a couple of hens going back and forth.”
For some reason, that comment always reminded me of HTTP.
HTTP is the set of rules a client and a server use to talk to each other. The client might be a browser, a mobile app, an API consumer, or a load-testing tool. The server receives a request, does some work, and sends a response. Your performance test is essentially creating and measuring a lot of those conversations.
For performance testing, HTTP is not just background knowledge. It is the traffic your protocol-level test generates and the evidence you use to understand what happened.
Performance Exploration For Testers MasterClass
The four parts of an HTTP request and response
HTTP/1.1 is easy to read, which makes it useful for learning. HTTP/2 and HTTP/3 use different framing under the hood, but the core semantics—method, URL, headers, body, and status—still apply.1
A typical HTTP message has four parts:
- Start line: The request identifies a method and target, such as GET /products HTTP/1.1. A response begins with an outcome, such as HTTP/1.1 200 OK.
- Headers: Metadata that helps the client and server understand the request or response. Common examples include Content-Type, Accept, Authorization, Cookie, Cache-Control, and Location.
- Blank line: In the HTTP/1.x text format, this marks the end of headers.
- Optional body: Data sent to the server or returned to the client. An API may receive JSON in a POST body; a browser may receive HTML, CSS, JavaScript, an image, or JSON.
Here is a simplified request for a product page:
GET /products/42 HTTP/1.1
Host: example.com
Accept: text/html
Cookie: session=abc123And here is a simplified response:
HTTP/1.1 200 OK
Content-Type: text/html; charset=utf-8
Cache-Control: max-age=300In a performance test, a test tool sends requests like this at scale and records what comes back. Your job is to verify more than “Did I get a response?” You need to know whether the response was correct, how long it took, how often it failed, and what the server-side telemetry says during the same interval.
HTTP methods: what the user is trying to do
The HTTP method tells the server the intended action. Do not reduce scripts to “GET versus POST.” Modern applications commonly use several methods.
| Method | Typical purpose | Performance-testing question |
| GET | Read a page, resource, or API representation | Is the page/API fast at expected cache and query conditions? |
| POST | Submit data or create an action, such as login or checkout | Can the system process writes safely at the planned rate? |
| PUT / PATCH | Replace or partially update a resource | Does an update create database, locking, or downstream-service pressure? |
| DELETE | Remove a resource | Does cleanup, authorization, or cascading work change response time under load? |
| HEAD | Request headers without a body | Are cache, content, or availability checks behaving as expected? |
| OPTIONS | Discover allowed communication options | Does cross-origin or preflight behavior add unexpected request volume? |
The exact endpoint and method are not enough by themselves. A realistic script may also need authenticated cookies or tokens, dynamic values, request headers, query parameters, test data, redirects, and pacing between steps. This is why recording a browser journey can be useful as a starting point—but never assume a raw recording is automatically a realistic load test.
How HTTP shows up in a performance test
A protocol-level performance test sends HTTP requests directly to the server or API. It can create a very high request volume efficiently and is excellent for testing backend capacity, API behavior, and specific components.
A browser-based test runs a real browser through a user journey. It can capture browser rendering, JavaScript execution, client-side routing, and user-interface behavior that an HTTP-only script does not measure. It costs more per virtual user and typically produces less raw load than a protocol-level test.
You usually need both approaches, matched to the risk. TestGuild’s guide to browser-based load testing versus JMeter explains the practical split: protocol-level testing is efficient for high-volume HTTP or API throughput, while browser testing checks whether a user can actually complete the journey.
| If the risk is… | Start with… | Why |
| API capacity, service limits, or a high-volume endpoint | Protocol-level HTTP test | It efficiently controls request rate, payloads, and endpoint mix. |
| Client-side rendering, user interaction, JavaScript errors, or page experience | Browser-based test | It exercises the browser behavior a protocol script bypasses. |
| A critical customer journey with both backend and frontend risk | Hybrid approach | Use protocol tests for scalable load and focused browser tests to validate the real experience. |
What to measure for every important HTTP request
A status code alone is not enough. A 200 response can still be too slow, contain the wrong data, or hide a downstream issue. At a minimum, define the following before the test starts.
| Signal | What it tells you | Example failure pattern |
| Status code and functional check | Whether the server returned an expected outcome and content | A 200 response returns an error page or wrong account data. |
| Response time percentile | How quickly the full response arrives for most users | p95 rises as database connections queue. |
| Latency / time to first byte | How long until the response begins | Slow backend processing or a delayed dependency increases waiting time. |
| Throughput | Requests or business transactions processed per second | RPS stops increasing as a capacity constraint is reached. |
| Error rate | How often the application fails the user or test | 429, 5xx, timeouts, and failed content checks rise under load. |
| Payload and cache behavior | Whether response size and caching add avoidable work | Large uncacheable assets slow a repeat visit or overload an origin. |
| Server-side traces, logs, and metrics | Why the client-side symptom occurred | A trace connects a slow checkout to a database call or third-party timeout. |
When you test a multi-step journey, report both the individual request measures and the business outcome. A checkout is not successful merely because the first HTML page returned 200.
HTTP status codes performance testers should know
HTTP status-code families are useful shorthand: 2xx means success, 3xx means redirection, 4xx means a client-side request problem, and 5xx means a server-side problem.2 But a performance test needs context. A redirect might be expected during login. A 404 can be intentional for an invalid lookup. A 429 may mean your rate limit is working as designed—or it may mean legitimate customers are being blocked.
| Code | What it means | What to do in a performance test |
| 200 OK | The request succeeded | Validate the expected content, response time, and payload—not only the code. |
| 201 Created | A new resource was created | Confirm idempotency and test-data cleanup for write-heavy tests. |
| 204 No Content | The request succeeded with no response body | Treat as success when it is the agreed contract; do not fail the test because a body is absent. |
| 301 / 308 | Permanent redirect | Check whether unexpected redirects create extra traffic or hide an incorrect URL. |
| 302 / 303 / 307 | Temporary or flow-specific redirect | Validate the expected login, payment, or navigation path; preserve method behavior where it matters. |
| 304 Not Modified | A cached representation can be reused | Test both cold-cache and warm-cache behavior when it affects real users. |
| 400 Bad Request | The server cannot process the request as sent | Usually a script, correlation, payload, or test-data issue. |
| 401 Unauthorized | Authentication is required | Check tokens, cookies, credentials, and expiry/refresh behavior. |
| 403 Forbidden | The server refuses access | Check authorization and account permissions; do not blindly retry. |
| 404 Not Found | The server cannot find the resource | Check dynamic URLs, test data, deployment, and expected negative cases. |
| 429 Too Many Requests | The client exceeded a rate limit | Determine whether rate limiting is an intended protection or a capacity/retry design issue. |
| 500 Internal Server Error | An unexpected server error occurred | Correlate with application logs and traces; count it in the user-visible failure rate. |
| 502 Bad Gateway | A gateway received an invalid upstream response | Inspect proxies, gateways, and the upstream dependency. |
| 503 Service Unavailable | The service is temporarily unavailable or overloaded | Treat as a capacity/reliability symptom; check recovery and Retry-After behavior. |
| 504 Gateway Timeout | A gateway did not receive an upstream response in time | Correlate the timeout with dependency latency, queues, and gateway limits. |
A five-minute HTTP inspection with Chrome DevTools
The old walkthrough recommends a Firefox extension called Live HTTP Headers. Replace it. Modern Chrome DevTools gives you the same practical visibility without adding an extension.
- Open the web application in Chrome.
- Open DevTools (F12, Ctrl+Shift+I, or Cmd+Option+I on macOS), then select Network.
- Reload the page while the Network panel is open. Each row is a resource or request that the page triggered.
- Inspect the Status, Type, Size, and Time Click an important request to review Headers, Response, Initiator, and Timing.
- Filter for Fetch/XHR to focus on API traffic, or use the filter box to isolate a URL, status, or domain.
- Enable a slower network profile only to understand a user scenario—not to claim that browser throttling replaces a load test.
Chrome documents that its Network panel shows a request’s status, type, initiator, size, time, headers, response, and timing breakdown.3 Use this inspection to understand the real journey before you design a script. It helps you identify redirects, API calls, static assets, headers, tokens, and caching behavior that a simplistic script might miss.
How to Prepare Your Systems for Peak Demand
Headers, cookies, caching, and authentication can change your results
Headers and state are often why a script works once but fails under load—or why it creates traffic no real user would create.
A request header can carry an authorization token, cookie, content preference, trace ID, or cache instruction. A response header can set a cookie, redirect a user, specify a content type, or control caching. If your test sends one shared session cookie for every virtual user, you might test session behavior that no production audience creates. If you skip a required authorization header, you may measure a wall of 401 responses instead of the endpoint you meant to test.
Caching changes both load and experience. Test a cold-cache visit when you need to understand a first-time user or origin burden. Test a warm-cache visit when repeat-user behavior matters. Make the state explicit. Do not quietly disable cache behavior in a test and then call the result production-like.
For deeper diagnosis, correlation headers can connect the client symptom to back-end work. In a TestGuild conversation about observability, Steve Flanders explained that software commonly propagates context through headers, such as a trace ID, across requests and transactions.4 That is useful when a slow or failed HTTP request must be traced through an API, a database, and a downstream dependency.
“You pass a header like a trace ID with a unique value, and that that’ll get passed through every single request or transaction in your environment.”
— Steve Flanders, Mastering OpenTelemetry and Observability, (TestGuild Podcast)
HTTP/2 and HTTP/3: know the difference, not every detail
You do not have to manually write HTTP/2 frames to test a web application. But you should know that an HTTP/1.1-style request/response explanation is a model for understanding the semantics, not a promise that modern traffic is literally plain-text lines on the wire.
HTTP/2 multiplexes multiple request-and-response streams over one connection and compresses headers. HTTP/3 keeps the same broad HTTP semantics while using QUIC rather than TCP. These differences can affect connection behavior, concurrency, header overhead, and how a tool or proxy records traffic.1
The tester’s job is simple: confirm which protocols, connection reuse, CDN, gateway, and browser conditions matter to your production architecture; use a tool that supports that environment; and compare like with like. Do not assume an old HTTP/1.1 recording represents every part of a modern browser experience.
A practical HTTP performance-test checklist
Before calling an HTTP script realistic, answer these questions:
- What user or API journey does the script represent? Name the outcome, not just the endpoint.
- Which requests are dynamic? Correlate tokens, IDs, cookies, and data rather than replaying stale values.
- What does success mean? Define expected status, content/response validation, response-time percentile, and acceptable error rate.
- What is the target load? Use production evidence to define concurrency, arrival rate, transaction mix, and pacing. See What Are Concurrent Users in Performance Testing?.
- What is the throughput target? Define RPS or successful TPS and interpret it with latency and errors. See What Is Throughput in Performance Testing?.
- What will explain a failure? Plan the server-side metrics, traces, logs, database signals, and dependency telemetry before starting the run.
Frequently asked questions
Is HTTP the same as HTTPS?
HTTPS is HTTP carried over a secure TLS connection. The request/response semantics that performance testers use—methods, headers, status codes, and bodies—remain familiar. HTTPS adds transport-security setup and certificate behavior that tools must support correctly.
Is a 200 response enough to pass a performance test?
No. A 200 only says the server reported a successful HTTP outcome. Validate the response content, response-time objective, error rate, business result, and relevant server-side behavior. A 200 response can still be too slow or contain the wrong data.
Is a 404 always a performance-test failure?
No. It is a failure when a required resource or dynamically generated URL should exist. It may be an expected result in a negative test. Decide that expectation before you run the test.
What is the difference between HTTP-level and browser-based load testing?
An HTTP-level test sends requests directly to the server or API and is efficient for high-volume backend testing. A browser-based test drives a real browser and captures client-side rendering and user interaction. Use the method that matches the risk, or combine them for a critical journey.5
What headers should a performance tester check?
Start with headers that affect routing, authentication, sessions, content type, caching, redirects, correlation, and rate limiting. Examples include Authorization, Cookie, Content-Type, Cache-Control, Location, trace-context headers, and Retry-After.
The key takeaway
HTTP is the language of most web and API performance tests. When you understand the conversation between the client and server, you can create more realistic scripts, distinguish expected behavior from genuine failures, and connect a response-time problem to the evidence needed to solve it.
The goal is not to memorize every status code. It is to ask better questions: What request did the user make? What did the server return? Was it correct, fast, and reliable at the planned load? And what evidence explains the result?
Continue with TestGuild’s guides to response-time testing, throughput in performance testing, concurrent users, and browser-based load testing versus JMeter.

Joe Colantonio is the founder of TestGuild, an industry-leading platform for automation testing and software testing tools. With over 25 years of hands-on experience, he has worked with top enterprise companies, helped develop early test automation tools and frameworks, and runs the largest online automation testing conference, Automation Guild.
Joe is also the author of Automation Awesomeness: 260 Actionable Affirmations To Improve Your QA & Automation Testing Skills and the host of the TestGuild podcast, which he has released weekly since 2014, making it the longest-running podcast dedicated to automation testing. Over the years, he has interviewed top thought leaders in DevOps, AI-driven test automation, and software quality, shaping the conversation in the industry.
With a reach of over 400,000 across his YouTube channel, LinkedIn, email list, and other social channels, Joe’s insights impact thousands of testers and engineers worldwide.
He has worked with some of the top companies in software testing and automation, including Tricentis, Keysight, Applitools, and BrowserStack, as sponsors and partners, helping them connect with the right audience in the automation testing space.
Follow him on LinkedIn or check out more at TestGuild.com.
Related Posts

Quick Answer Browser-based load testing (also called real-browser load testing) drives real browser sessions through your critical user journeys under […]

What is Throughput in Performance Testing? Throughput is the amount of work an application completes over a given period. In […]
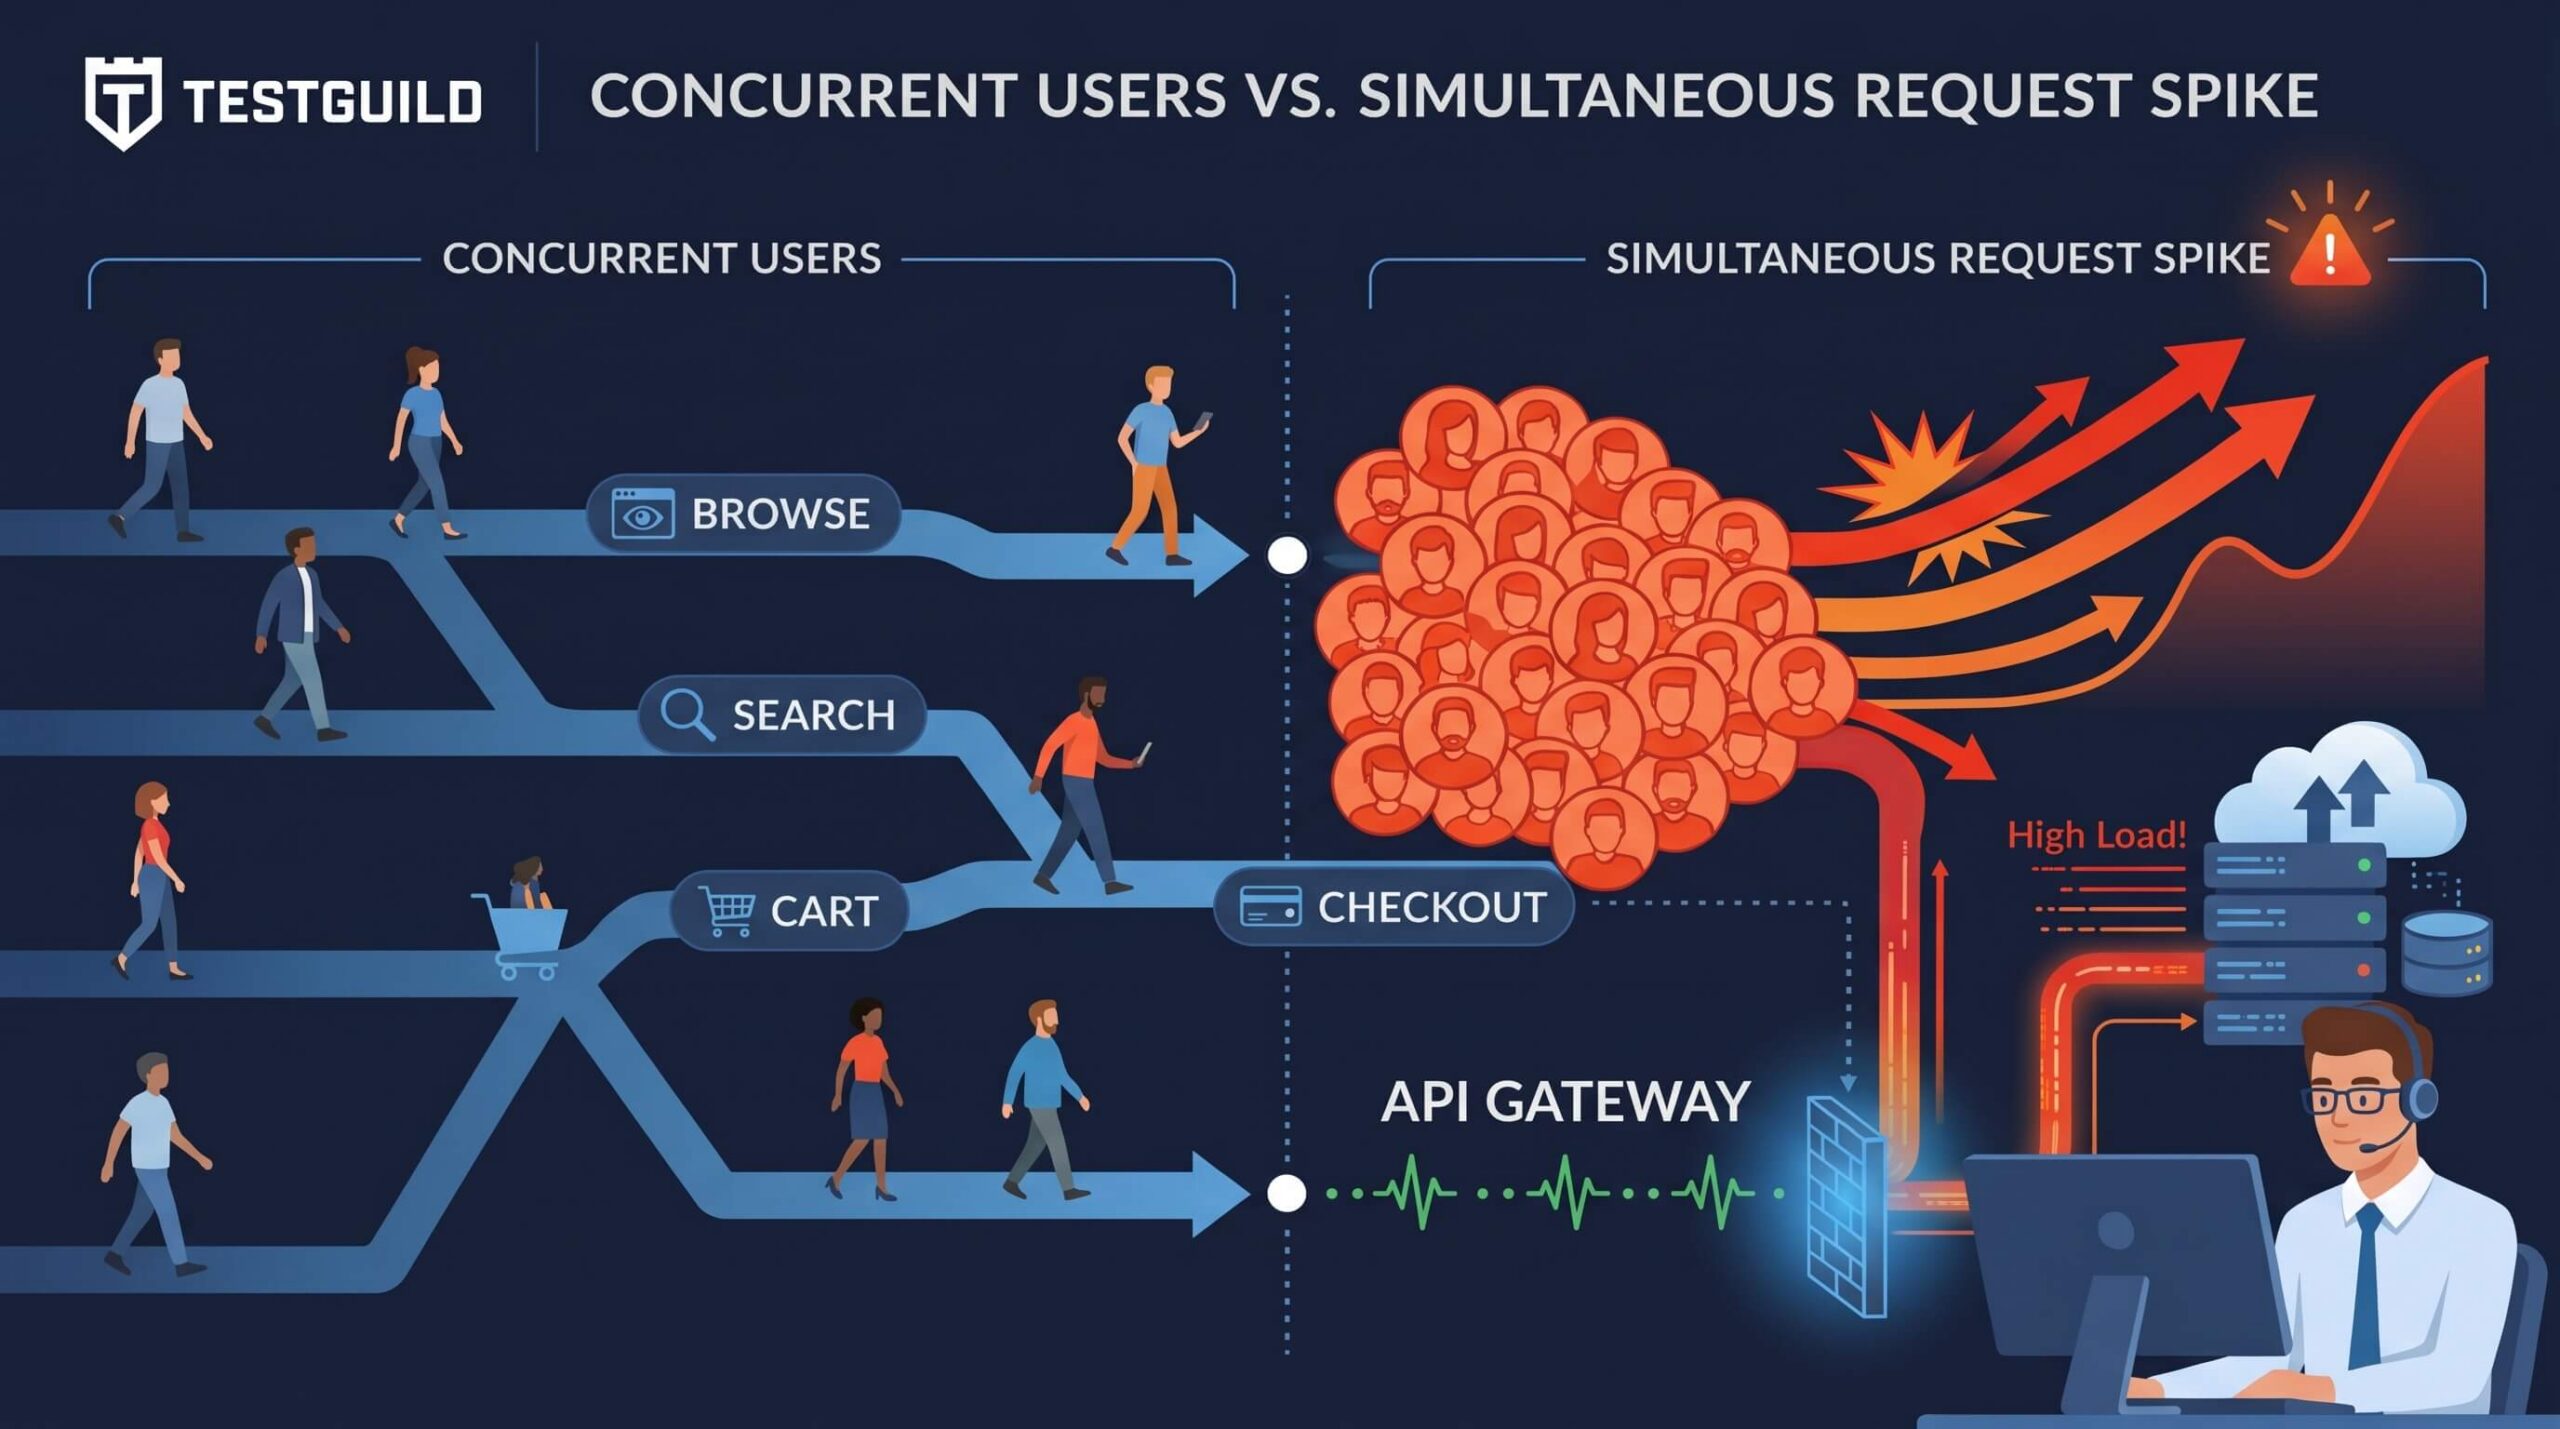
Concurrent users are the people or virtual users who are active in an application during the same time window. They […]

Disclosure: OctoPerf is a TestGuild sponsor. All opinions are my own. Here’s a pattern I’ve seen over and over again […]