What is Throughput in Performance Testing?

What is Throughput in Performance Testing?
Throughput is one of the most misunderstood performance testing concepts new testers sometimes struggle with. So what is throughput?
Here are the three best definitions of throughput:
- Basically, “Throughput” is the number of transactions produced over time during a test.
- It’s also expressed as the amount of required capacity that a website or application can handle.
- Also, before starting a performance test run, it is common to have a throughput goal that the application needs to be able to handle a specific number of requests per hr.
Read on to learn more about:
- A brief overview of throughput
- How to measure throughput in your performance tests
- Examples of throughput in practice
INDEX
[ez-toc]
Let’s Imagine Throughput in the Real World

For example: Imagine a gas station attendant filling up a car’s gas tank using a gas pump.
Let’s also say that it always takes the gas attendant just one minute to fill up any car, no matter how big it is or how low the car’s gas tank is.
Let’s call this gas station “Joe’s Gas” and envision that it only has three gas pumps. Naturally, if we have three gas pumps and three cars, it follows that Joe’s attendants can only fill up three cars per minute.
So, if we were to fill out a performance report for Joe’s gas station, it would show that Joe’s throughput is three cars per minute.

This is Joe’s dilemma: no matter how many cars need gas, the maximum number that can be handled during a specific time frame will always be the same –three.
This is our maximum throughput; it is a fixed upper-bound constraint.
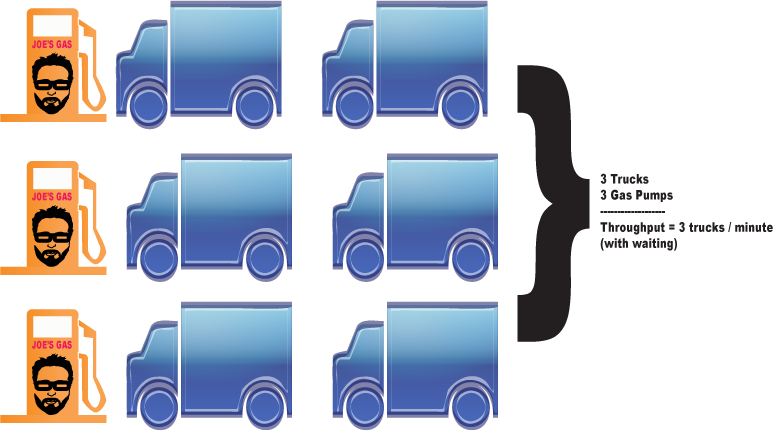
As more vehicles enter the gas pump line, they are required to wait, thus creating a queue.
It is the same concept that applies if we are testing a web application. If a web app receives 50 requests per second but can only handle 30 transactions per second, the other 20 requests end up waiting in a queue.
In short, actual throughput in performance testing is often expressed as transactions per second or TPS.
Automation Testing Free Courses
Real Performance Testing Throughput Results
I use HP’s LoadRunner (which comes with a throughput monitor) for performance testing. But other tools like jMeter have similar meters.
In a typical test scenario, these would definitely happen:
- As users begin ramping up and making requests, the throughput created will increase as well.
- Once all users are logged in and processing in a steady state, the throughput will even out since the user load test stays relatively constant.
- If we wanted to find an environment’s throughput upper bound, we would continue increasing the number of users.
- Eventually, after a certain amount of users are added, the throughput will start to even out and may even drop.
- However, if the throughput enters this state, it is usually due to some kind of bottleneck in the application.
Get TestGuild Partnership Plans
A Look at Typical Throughput Results
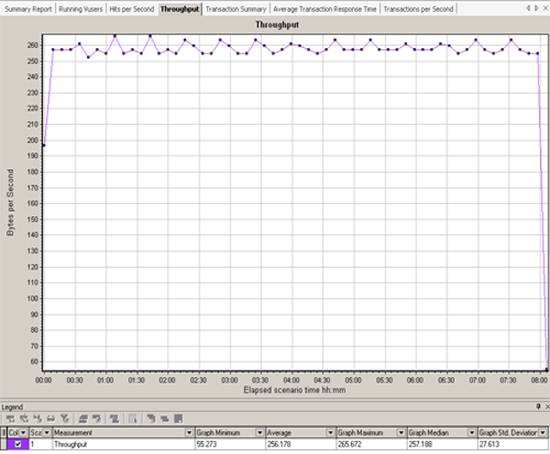
Below are the LoadRunner throughput chart results for a 25-user test that I recently ran.
Test #1
Notice that once all 25 concurrent users are logged in and doing work, the throughput stays fairly consistent. This is expected.
Test #2
Now notice what throughput looks like on a test that did not perform as well as in the last example.
All users login and start working; once all users are logged in and making requests, you would expect the throughput to flatline.
But in fact, we see it plummet. This is not good.
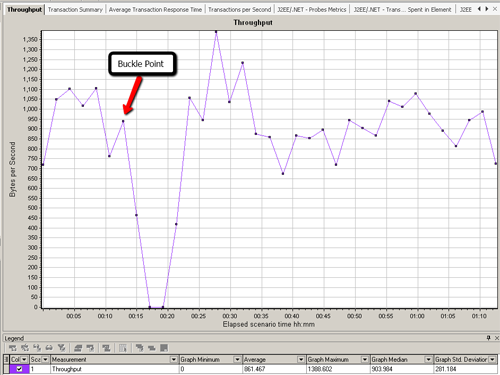
As I mentioned earlier, throughput behavior like the above example usually involves a bottleneck.
Test #3
By overlaying the throughput chart with an HP Diagnostics ‘J2EE – Transaction Time Spent in Element’ chart, we can see that bottleneck appears to be in the database layer:
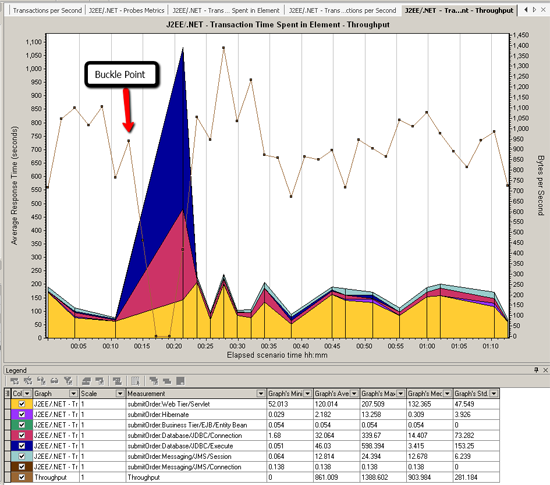
In this particular test, requests were being processed by the web server. But in the back end, work was being queued up due to a database issue.
As additional requests were being sent, the back-end queue kept growing, and users’ response times increased.
To learn more about HP Diagnostics, check out how I configured LoadRunner to be able to get these metrics in my video: HP Diagnostics – How to Install and Configure a Java Probe with LoadRunner.
What factors contribute to degraded network throughput and latency?
Several factors contribute to degraded network throughput and latency in a network environment.
Degraded network throughput can result from hardware issues, such as using obsolete routers or devices that are faulty, which can hinder the efficient flow of data. Additionally, heavy network traffic can lead to packet loss, further impacting network throughput.
On the other hand, network latency can be influenced by various elements within the network infrastructure. Propagation delay occurs as packets travel from one point to another at the speed of light. The transmission medium, whether it is optical fiber, wireless, or another type, introduces delays that can vary based on the specific medium used.
The size of packets also affects latency, with larger packets taking more time to transmit and receive compared to smaller ones. Furthermore, the use of repeaters to amplify signals can introduce additional latency.
Moreover, the processing time of routers plays a role in network latency as gateway nodes need to inspect and potentially modify packet headers, affecting the overall transmission speed. Computer and storage delays may occur within networks, with intermediate devices like switches and bridges potentially causing delays due to storage and hard disk access processes. It is important to note that backbone statistics may not always consider these types of latency factors, which could impact network performance.
What tools are available for measuring and monitoring network throughput?
Various tools are available for measuring and monitoring network throughput. These tools serve different purposes and cater to various preferences.
Some commonly used tools include Simple Network Management Protocol (SNMP), Windows Management Instrumentation (WMI), tcpdump, and Wireshark.
- SNMP, an application-layer protocol, is utilized for managing and monitoring network devices and their operations, providing a universal language for devices to communicate management information in both single- and multivendor environments. The latest version, SNMP version 3, boasts advanced security enhancements ensuring the authentication, encryption, and protection of SNMP messages during transmission.
- WMI, a set of specifications developed by Microsoft, aids in centralizing the management of devices and applications within a network powered by Windows systems. WMI grants users access to vital information concerning the status of local or remote computer systems, facilitating a range of actions like configuration, security settings, permissions, error logging, and much more.
- Tcpdump, an open-source command-line tool, is instrumental in monitoring and capturing network traffic, displaying packet headers for analysis and comparison against specific criteria. Capable of recognizing boolean search operators, tcpdump allows for filtering based on host names, IP addresses, network names, and protocols.
- Wireshark is another noteworthy open-source tool for network traffic analysis, offering insight into various details such as transmit time, protocol type, header data, source, and destination information. It is commonly employed by network and security teams to evaluate security incidents and debug network-related challenges effectively.
Also many performance testing tooling capture this data as well but may call it request per second. For example the load testing tool k6, throughput is measured in requests per second.
What is Throughput Recap

To recap: Throughput is a key concept for good performance testers to understand and is one of the top metrics used to measure how well an application is performing.
I’ve also written some other posts on other concepts that a performance test engineer should know about:
- What is resource utilization?
- What are concurrent users?
- What is the Response time?
- Performance Testing Basics – Four Steps to Performance Nirvana
Extra Performance Testing Awesomeness for your Ear Buds
For more detailed info on performance testing, make sure to grab a copy of the Performance Analysis for Java(TM) Websites. Also, make sure to check out some interviews with some of the biggest names in performance testing to discover even more performance testing awesomeness on our TestGuild Performance & SRE Podcast.

Joe Colantonio is the founder of TestGuild, an industry-leading platform for automation testing and software testing tools. With over 25 years of hands-on experience, he has worked with top enterprise companies, helped develop early test automation tools and frameworks, and runs the largest online automation testing conference, Automation Guild.
Joe is also the author of Automation Awesomeness: 260 Actionable Affirmations To Improve Your QA & Automation Testing Skills and the host of the TestGuild podcast, which he has released weekly since 2014, making it the longest-running podcast dedicated to automation testing. Over the years, he has interviewed top thought leaders in DevOps, AI-driven test automation, and software quality, shaping the conversation in the industry.
With a reach of over 400,000 across his YouTube channel, LinkedIn, email list, and other social channels, Joe’s insights impact thousands of testers and engineers worldwide.
He has worked with some of the top companies in software testing and automation, including Tricentis, Keysight, Applitools, and BrowserStack, as sponsors and partners, helping them connect with the right audience in the automation testing space.
Follow him on LinkedIn or check out more at TestGuild.com.
Related Posts

Disclosure: OctoPerf is a TestGuild sponsor. All opinions are my own. Here’s a pattern I’ve seen over and over again […]

Look, I’ve been doing automation testing including performance testing for over 25 years. And in that time, the #1 question […]
Look, performance testing has the biggest gap between “we should really do that” and “we actually do that” of any […]

Regarding e-commerce, Black Friday is the ultimate test of endurance. It’s one of those days of the year, along with […]