
Unhappy user experience and lost revenue are all side-effects if you don't get this performance concept right.
So read to the end of this tutorial to make sure you know how to measure response time accurately and why performance testing is so important.
Like anything I always like to start with the why?
Why is Load Time so important?
Why should you care about the load time of your application? Here are some numbers I found recently that I tell the story best.
- Wal-Mart increased their conversion rates by 2% — for every 1 second of improvement to their load times…
- Intuit improved their load times by 50% and increased their conversions by 14%…
- GQ improved their load times by over 50% — which increased their traffic by 83%…
What is Response Time Testing in Performance?
When performing a load or stress test there are many measurements that you can collect.
But it all starts with you developing a test that sends a request to your application under test.
After a request is sent to an application, response time measures how long it takes for a response to return back from the application. (This is also sometimes referred to as “round-trip” time.)
Response time is important in performance testing because it represents how long a user must wait for a request to be processed by an application.
Slow response time equals an unhappy user experience, and may also result in the loss of revenue.
Free Course: Performance Exploration For Testers
Brick and Mortar Response Time Testing Example:
To use a real-world example: imagine a gas station.

Let's say that the gas attendant takes one minute to fill your car's gas tank.
If there are cars in front of you waiting for gas it may take you some time before you get to the gas attendant.
So, the total “response time” would be the one minute it took to fill your gas tank plus the time you had to wait beforehand.
Performance Testing Response Time Online example:
Let's say that Joe's Gas Station has an online site that you can visit to add funds to a gas card.
You start a browser, and navigate to Joe's Gas online and make a request to load the card.
The browser submits a request to the website, and you wait to be directed to Joe's Gas confirmation page in the browser.
If the site is handling a large number of customers at the same time, your request may not be instantly processed; just like the brick and mortar example, your request may wait in a line (queue) before it's actually processed.
Your “response time” would be the amount of time that elapses between the moment you entered your request and the time you were returned to the HTML screen in the browser.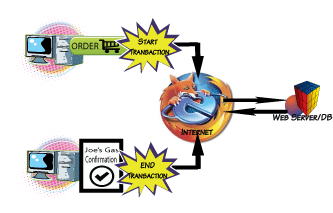
Make sure not to get this concept confused with testing throughput.
How is it Response Time Measured?
All performance testing tools have a way to measure response times.
Response Time is measured in a test tool by surrounding an important business process with Start and End transactions.
A business process could be an action or set of actions a user performs in an application in order to complete a business task.
Some examples would be a Google search, a login to an application, or a book purchase on Amazon.com.
For instance to measure a business process within a tool like LoadRunner, you would use the lr_start_transaction to insert immediately before the action you wish to measure, and then add a lr_end_transaction immediately afterward.
Course: API Performance Testing With Karate
Brick and Mortar Response Time Example:
Performance tools to use for response time testing
I have a list of over fourteen performance testing tools you can use for measuring load times of your application business functions.
But the most common ones are:
- LoadRunner – Even in 2020, the most popular load testing tool for enterprise testing is LoadRunner. However, it is very expensive. The good news is they do have a community edition you can use to get started for free.
- JMeter – by far JMeter is the most popular open-source testing solution you should check out.
- k6 – Still relatively new k6 is a great option for developer-centric type performance testing.
Performance Testing Best Practices
Hopefully, you can agree that focusing your time on improving the response times of your application is a key best practice in software development.
But Load time is just one of the nine performance best practices you need to know about to create a proper load test.
Make sure to check out all my other performance testing related posts as well.
What do the Experts Say about Response Time Testing?
I've interviewed many performance engineers on my podcast and online events over ten years and here is some of the best advice I've gotten around performance and response time.
Gopal Brugalette noted that “we build a machine learning model to understand customer experience, starting with feature engineering. We analyze data metrics like CPU, memory utilization, response time, and user load. Response time is a key metric for customer experience, often driven by user load. By graphing response time against user load, we observe a linear relationship, indicating that as user load increases, response time also increases. This linear correlation helps us use a linear model for predictions. In some cases, other mathematical techniques may be needed to evaluate data fit.”
Rebecca Clinard: The load tool KPI is a front-end KPI. The performance tool reports on these typical KPIs, and we know that the correlation of these front-end KPIs shows the current scalability. The typical performance capacity story goes like this: the virtual user load ramps up, the transactions per second (TPS) increase, the load approaches the deployment's current capacity, the TPS plateaus, response times start to increase, TPS begins to decrease, and eventually, error rates occur.
Keshav Vasudevan tol me that response time refers to the duration from when the client sends a request to when the response is received or downloaded. High response times can indicate high server load, bloated web pages, memory leaks, caching issues, or lack of caching. Caching helps deliver content faster, often facilitated by CDN providers. If response times are high, it may be worth consulting your CDN provider or considering using a CDN.
Application server metrics like throughput can also be useful. Throughput, or transactions per second (TPS), can correlate with response times, especially if requests are sequential. In such cases, longer response times mean lower TPS, indicating the system's inability to handle many transactions. However, if requests are parallel, this correlation is harder to establish.
A lower TPS does not necessarily indicate a problem with the application server; it must be compared to a baseline. Effective caching, for example, can reduce server workload and improve performance. In the provided example, TPS builds to a certain point and then drastically drops, clearly indicating the system's capacity limit.


nice article ….
Simple and easy to understand. Nice one.
How to read /fetch Total time from web performance test results