Knowledge of HTTP is essential for understanding how your web performance test scripts (and the web in general) work. When you’re looking at performance logs, this understanding will help you to verify that a HTTP request was successful and that there were no errors generated during a test run.
What do hens and HTTP have in common?
[smartads]
Several years ago, while on a road trip with my wife and her parents I was driving shotgun with my father in law, who was driving behind my wife and her mother, who were in a separate car. At one point, my father in law motioned to my wife and her mother and said, “Look at the two of them talking. They look like a couple of hens going back and forth.”
For some reason, that comment reminded me of HTTP. Similar to my wife and her mother communicating some private, womanly protocol, HTTP is the protocol that web clients (like a browser) and a server use to talk to one another.
3 Main Elements that Make Up a HTTP message
All HTTP messages are generally made up of three main parts:
- Request– a client makes a request using either a GET or a POST method
- GET method – is a request for info located at a specified location on the server
- POST method – allows data to be sent to the server within a client’s request (an html form would be one example)
2. Headers – zero or more header lines that can contain information, like Browser, OS, Accept and Cookie info.
3. Body – An optional message body
How Does a Web Performance Test Tool Work with HTTP?
When you record an HTTP script in a performance tool like LoadRunner, the tool captures all of the communication between the browser and the Web server. The captured info becomes part of the script, which is then played back. When you run the script it interacts with the web application — just like a real user.

Let's look at an Example of a HTTP Request and Response
When making a request from a browser, you don’t often see the HTTP being passed back and forth along with the headers; however, looking at this info is easy if you employ a Firefox extension tool , such as “Live Http.”
Let's take a look at what an actual request and response looks like:
-
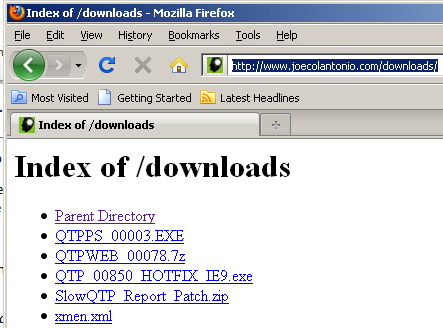
In Firefox, start up “Live Http” headers and navigate to: https://testguild.com/downloads/

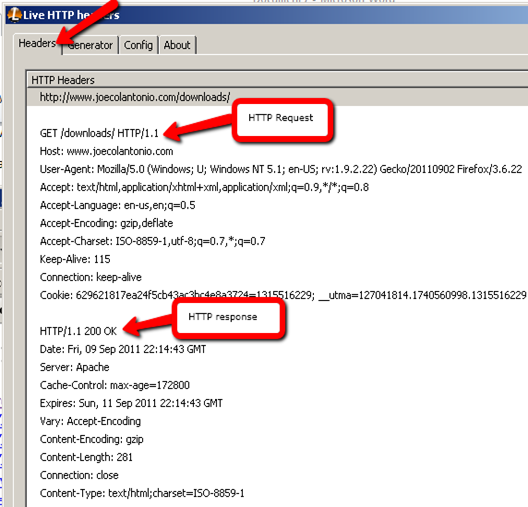
- Next, take a look at the Headers tab in Live HTTP headers:

The Requests to https://testguild.com/downloads/
- Looking at the above, we can see that the first line in the request uses the GET method to request the document downloads.html using HTTP version 1.1
- Next, the client sends header information, such as the browser version, to tell the servers its configuration and the type of docs it will accept.
- The client then sends a blank line to end the header.
The Response back from https://testguild.com/downloads/
- The first line of the response contains the HTTP version and status code along with the status description. Status 200 means that our client’s request was successful. Cool!
- Next, the server sends its header info to the client along with the requested doc.
- A blank line ends the header.
- Since the client’s request was successful, the requested data is sent.
HTTP Status Codes
Our example returns the status code 200, so we know everything is okay with the request. However, there are many other things that could have gone wrong. Here are the HTTP status codes and their descriptions:
| Status | Description |
Response's in the range of 200-299 mean that the request was successful
200 OK – The request succeeded
201 Created – The request was fulfilled and a new URI was created
202 Accepted – Request accepted but not immediately acted upon
203 Non-authoritative Information – info in the entity header is from a local or third-party copy and not found on original server
204 No Content- request received but no info to send back
Response's in the range of 300-399 mean that the request was not performed – further action needed
300 Redirection
301 Moved – The data requested has a new location and the change is permanent
302 Found – The data requested has a different URL temporarily
303 Method – Under discussion, a suggestion for the client to try another location
304 Not Modified – The document has not been modified as expected
Response's in the range of 400-499 mean that the request was incomplete and may need more info
400 Bad Request – Syntax error in the request or it could not be satisfied
401 Unauthorized – The client is not authorized to access data
402 Payment Required – indicates a charging scheme is in effect
403 Forbidden – Access not required even with authorization
404 Not Found – Server could not find the given resource
Response's in the range of 500-599 mean that the server encountered an error
500 Internal Error – The server could not fulfill the request because of an unexpected condition
501 Not Implemented – The server does not support the facility requested
502 Server Overloaded – High load or servicing – in progress
503 Gateway Timeout – Server waited for another service that did not complete in time.


Good one!
I was just trying to figure out,how I can use it for my benefit.What I found out is that it is quite easy to crack the passwords if POST method is used for login request.
I guess I found a bug in the security of our product.
Thanks,
I meant even if POST is used
Good article,
Simple and easily understandable, please post more performance related articles.
Thanks for your time and effort….
Prince3105 » Glad you liked it. I tend to post about things that I’m currently working on but will try to include more performance post. Thanks for the feedback — it really helps me to know what my reader want. Cheers~Joe
Nice article!!
I have run a test with 500 users for 1 hr and I am getting following results for HTTP responses
HTTP 302 –>148,305 –>40.311 per second
HTTP 404 –> 647 –> 0.176 per second
Is this a bad performance issue??
Thanks in advance.
sr » Not sure what your team would consider bad performance. Depends on what is being returned. In general I would say that 40 seconds to receive a response back from a server is not optimal. Anyone else agree/disagree?
That looks like 40 HTTP 302 requests being returned per second and NOT 40 seconds per request response time!
I’m seeking help in resolving an issue with a load runner script.
I am attempting to record and replay a load runner script using the AjaxTruClient – FireFox protocol.
The recording happens successfully, but when I attempt to “Replay” the script, it fails at a point where I am trying to “drag and drop” a particular COLUMN (from a table) inside my application. I think that Load Runner recognizes the “actual table” as the “object” and NOT able to recognize the “Column” inside the table as the “object”. That’s the reason, why the script doesn’t Replay successfully. Am I right?
Can you help me, in making this work in Load Runner?
I am bound to use the same table and the same column (unchanged).
Any help or advise is much appreciated.
what does a 404 error means during recording? and how can we solve the 404 not found ?
here is the detail
/* Request with POST method to URL “https://www.aaa.com/misc/ajax/ajax.jsp?_DARGS=/www/cartridges/cart/subTotalContainer.jsp.shoppingCart-login” failed during recording. Server response : 404*/
Have you confirmed that the item is still there? A 404 error is often returned when pages have been moved or deleted.
I want to know whether should we leave 501 response code? Because I see this error doesn’t affect to server when user entering wrong header, body or method