How to Reuse Functional Test for Performance Testing

For the past couple of years, I’ve heard lots of talk about using UI browser-based automation tools for performance testing as an alternative to more traditional load testing tools like JMeter and LoadRunner at the protocol level.
But why?
One-User Performance
Before we get into it, let’s talk a little bit about one-user performance.
James Pulley of PerfBytes reminded me in our last TestGuild Performance podcast that most engineers only focus on how their applications perform for many concurrent users. How many, though, can answer the question, “Does it scale for one?”
Does the feature meet your performance requirements for a single user?
Keep in mind that at a basic level, almost every functional testing tool out there has a timer structure built in.
So why not take advantage of that and ask the question, “How fast is the page? How quick is the response?” Track it and report it.
If you do, odds are you’ll find out a lot earlier in the test cycle that your code is not necessarily performant.
This is one of the reasons I enjoyed using the Serenity framework at my previous job. After running my test suite, Serenity generated a comprehensive report automatically. That report contained the amount of total time it took to run each test.
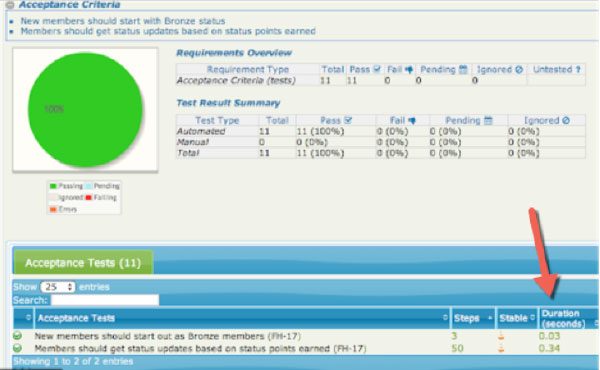
Sending this data to my automation dashboard enabled me to track an individual test’s runtime duration over time.
This made it easy to look at a chart and spot potential areas that might have performance issues in our application after each sprint, and determine whether any new feature caused a problem.
Other frameworks most likely have similar functionality.
What about capturing actual network timings?
Also, functional testing tools like Cypress has examples of how to capture Google Chrome’s performance data for their test runs. This allows you to find and fix issues like slow time-to-first byte.
Selenium has a few ways to capture performance data as well. One common approach is using a HAR file. An HTTP Archive format, or HAR, is a JSON-formatted archive file format for logging a web browser’s interaction with a site.
An example of this is leveraging the open-source BrowserMob Proxy (BMP). BMP allows you to manipulate HTTP requests and responses, capture HTTP content, and export performance data as a HAR file.
BMP works well as a standalone proxy server, but it is especially useful when embedded in Selenium tests. Once you have the HAR file, you can upload the file to a dashboard solution like Elastic Stack and analyze the results.
If you’re already using SauceLabs to run your test suites, good news!
SauceLabs has released a new feature to help you monitor your application’s front-end performance. To begin capturing performance values in SauceLabs, all you need to do is add two new capabilities to your existing WebDriver tests.
To learn more, check out my post on Performance Testing with SauceLabs.
Browser vs. Protocol-Level Performance Script
With modern software development, it’s clear that more and more firms are looking for ways to leverage functional testing tools for stress and load testing activities as well.
Why?
Some folks might be wondering why they shouldn’t just use a non-UI-based protocol.
Modern JavaScript front-end frameworks like Angular and React makes it very difficult to create a performance script at a protocol level, which is kind of the traditional way testers have been creating performance tests since the mid-nineties.
The fact is that most current web applications are, single-page apps, so there’s a lot of client-side business logic being used.
In such cases, there is no interaction between the UI and the server like you’d find in a typical, older, client-server application architecture.
With protocol tools, you would have to do additional scripting and programming to capture those kinds of transactions as well.
So, the process of setting up a script becomes increasingly difficult.
While I agree that protocol-level performance is the optimal approach, there’s something to be said for not having to figure out how to write scripts in, say, Winsock, since it’s not the easiest thing to do.
Remember: load testing is simply a means to an end.
The main goal is to observe areas of performance like elasticity, availability, reliability, and scalability under load.
It’s what you do about those dimensions that make all the difference in your load testing efforts.
To do something about them, you have to be able to simulate load in the first place. And that’s where I see many people, both new and old to performance testing, spend too much time.

Benefits of Browser-Based Performance Script Creation
In my experience, testers spend a disproportionate amount of time building and maintaining load test scripts at the protocol level to simulate that demand.
And that’s all at the cost of execution and analysis, which is the whole point of load testing (and where we should be spending the majority of our time. Unfortunately, however, we kind of get sucked into this enormous sinkhole of load test creation.
By focusing on browser-based performance script creation, you’re spending less time doing any of the other manual editing, correlation and programming that would otherwise be necessary with a protocol-based recording tool.
Furthermore, because this approach uses a real browser and more people are familiar with interacting with the actual browser rather than a protocol, this helps to shift-left the performance activity that more teams probably should get involved in.
Moving from a Protocol to a Browser Performance Mindset
The way you plan for a protocol-level load test and a browser-based one is pretty much the same.
Where it differs slightly is in the analyzation phase.
Keshav Vasudevan, a product manager at SmartBear, believes it’s essential to have a different mindset when you analyze the results, because the metrics you may be getting from a browser-based approach could be traditionally different from some of the metrics you used to see in a protocol-based approach.
Keshav recommends a three-level framework to help.
Level One
The KPI he recommends is to start by looking at the results from the end-user perspective.
This involves looking at things like how long it’s taking for all of those browsers at any given point of the load test to go through all the actions you’ve defined in your script.
Let’s say, for example, that 50 seconds into a load test you realize that for one virtual user it’s taking about ten seconds to go through a specific transaction.
So, you can start by identifying certain trends, like discovering how your real users are actually using the application.
Because it’s a real browser test you can find some anomalous trends for thins like whether there’s a spike in the time, if it’s taking to execute those transactions, and identify the pages that may be causing some degradation.
Level Two
Level two is all about navigational timings.
This is another advantage of going to the browser-based testing approach, because you get mostly browser-based metrics that you typically may not find in a traditional, protocol-based tool.
For instance, you can now track things like DNS time, download time, the time it takes to process all of the images, fonts, etc. across the network and rendering it the DOM.
Any event time that may be associated with the browser, like executing a JavaScript function, the response time, the time to the first byte, and other metrics that are part of your overall navigation timings.
You may see if there are any interesting trends that you’re identifying and correlate that with the unusual patterns you identified in the durations it’s taking for the virtual users to go to the transactions.
For example—say the DNS time is high.
Maybe there’s an issue in the DNS lookup. Maybe the DOM load time is too long. Or maybe there are certain resources in your application that are taking a while for the browser to process at any given instant.
Level Three
After you identify certain key behaviors, the next level is to see how long it’s taking for the browser itself to process all those resources, and essentially determine whether there are any unusual trends there, as well.
And once you complete all three levels, you may be able to identify specific key trends as to what may be going wrong, and discover how to fix it.
Another benefit to this approach is that the results you get from a browser-based approach are typically the results that developers are used to using when developing and building applications.
That makes it simpler to diagnose the issue. It also makes it easier to approach a developer and ask, “Hey, this is where I think the problem is. Why don’t we work together to solve it?”

Tools for Browser-Based Stress Testing
What are some ways you can leverage your functional tests for more-than-one-user performance testing activities?
The following are some tools that can help.

Flood.io Element
Element is an open-source Puppeteer that uses a browser-based load testing tool. You create scripts using Typescript, and can use it against your Web app in the same way that your customers do, opening a browser and interacting with page elements.
It’s written like a functional test script, but with the help of Flood, you can quickly run a load test on as many nodes you want in the Cloud.
LoadNinja
LoadNinja gives you the ability to create a test script from the browser perspective, meaning you create and capture transactions from the end user thats interacting with your application directly from the browser.
In the past, spinning up more than a few hundred browser-based tests consumed a lot of resources. With LoadNinja they’ve been able to perfect this mechanism to spin up tens of thousands of real browsers on the fly while still being cost effective.
LoadNinja can also use some machine learning algorithms to analyze all of your network-based information.

Taurus
Taurus gives you the ability to convert existing Selenium scripts into JMeter JMX files.
Taurus id an open-source automation framework built on JMeter and it will convert anything to anything. So, you can give it a Selenium script for your functional tests and it will generate a JMeter script out of the other side without you writing a single line of code.
Some teams run all their functional tests through Taurus to create their nonfunctional tests.

Selenium to JMeter
If you take the HAR file you created with your Selenium test earlier, you can actually convert it to a JMX, which is a formatted test plan for JMeter. Check out Flood.io’s article convert HAR files to JMeter test plans which will show you how to do this.
Browser-Based Automation for Everything
Is this approach for everyone? In a word, no.
If you are not using JavaScript-intense front-ends and all your business logic is on the back end, you should stick with protocol-level performance testing.
Even though Protocol-level performance scripts may be harder to create, I’ve found them to be much more reliable than Selenium scripts.
But, of course, every team is different.
Performance-Driven Development (PDD)
It’s easy to get caught up in the tooling and technique, but you should be putting more emphasis and focus on performance as you build your applications.
Ultimately, you want your applications to drive business.
Consumers are becoming more and more impatient. If you’re old enough to remember 15-20 years ago, you’d have been happy waiting 20 seconds for a video to load.
Nowadays, if a video doesn’t load in two seconds, you’re going to move on to the next page or next video.
Your switching costs are getting lower.
It’s essential for software teams to keep an open-minded approach to performance-driven development.
Start thinking about performance from the code optimization layer. When you actually are defining and building the UI and then launching it and employing all those different frameworks that may or may not add up to the overall load time of application.
Have an open mind towards what the best practices are, and what is the best tooling that currently exists.
UI-based load testing doesn’t solve everything.
Protocol-based load testing doesn’t solve everything either.
There’s always going to be give and take.
You and your teams, as a complete testing organization, need to define what is most important to you.
Performance for Everyone
Lastly, I believe performance testing is not something that should only be accessible to a few, but instead should be accessible to everyone.
Everyone should be able to do performance testing with at least some degree of success, and hopefully achieve a full motion of end-to end performance during development in the application life cycle.

Online Performance Testing Conference
Want to really take your performance testing to the next level?
Make sure to check out and register for our next PerfGuild an online conference dedicated 100% to helping you succeed with all your performance testing efforts.

Joe Colantonio is the founder of TestGuild, an industry-leading platform for automation testing and software testing tools. With over 25 years of hands-on experience, he has worked with top enterprise companies, helped develop early test automation tools and frameworks, and runs the largest online automation testing conference, Automation Guild.
Joe is also the author of Automation Awesomeness: 260 Actionable Affirmations To Improve Your QA & Automation Testing Skills and the host of the TestGuild podcast, which he has released weekly since 2014, making it the longest-running podcast dedicated to automation testing. Over the years, he has interviewed top thought leaders in DevOps, AI-driven test automation, and software quality, shaping the conversation in the industry.
With a reach of over 400,000 across his YouTube channel, LinkedIn, email list, and other social channels, Joe’s insights impact thousands of testers and engineers worldwide.
He has worked with some of the top companies in software testing and automation, including Tricentis, Keysight, Applitools, and BrowserStack, as sponsors and partners, helping them connect with the right audience in the automation testing space.
Follow him on LinkedIn or check out more at TestGuild.com.
Related Posts

Disclosure: OctoPerf is a TestGuild sponsor. All opinions are my own. Here’s a pattern I’ve seen over and over again […]

Look, I’ve been doing automation testing including performance testing for over 25 years. And in that time, the #1 question […]
Look, performance testing has the biggest gap between “we should really do that” and “we actually do that” of any […]

Regarding e-commerce, Black Friday is the ultimate test of endurance. It’s one of those days of the year, along with […]