What is ReportPortal?
Report Portal is a powerful tool for enhancing automation testing analysis and reporting. It provides features such as auto-analysis, which saves time by automatically analyzing failed tests based on historical data, and unique error analysis, which groups together similar failures to streamline investigation. With Report Portal, QA teams can easily track and manage test results, as it integrates with popular automation frameworks and CI/CD tools. The tool offers configurable dashboards and widgets for visualizing key metrics and identifying trends, as well as detailed logs and stack traces for debugging.
By leveraging Report Portal, teams can reduce manual effort spent on analysis, improve collaboration, and gain valuable insights to optimize their automation testing processes. Its ability to store and compare historical test data enables teams to identify recurring issues and make data-driven decisions. Ultimately, Report Portal empowers QA teams to deliver high-quality software more efficiently through comprehensive automation testing analysis and reporting capabilities.
Now that you know what ReportPortal is let's jump in!
INDEX
Looking for an easy-to-install-and-use dashboard?
Need to triage your automation test results as well as create awesome graphs?
Even better, what if it were free?
Well, I’ve got something you should check out if you’ve been looking for an automation test results dashboard solution: ReportPortal.io.
Here’s a quick video of me learning about it.
INDEX
Easy To Get Started Automation Testing Focused Dashboard
I know some of you have created dash boarding solutions with Elastic Search and Grafana, but those tools have a pretty big learning curve.
With Report Portal, you get all the benefits of those types of dashboards in an out-of-the-box, almost one-click solution.
Real-Time Reporting
One of the critical benefits of Report Portal is its real-time reporting.
It’s an excellent time-saving feature. Sometimes teams are waiting around to begin viewing their test results, or they make the excuse that they didn’t have time to debug.
With this solution, they can start seeing results in the dashboard a few seconds after the execution has begun, which allows for real-time debugging.
That means if a test case begins failing because of environmental issues or bad build, etc., rather than wait until the next day to find out, issues can be checked out in a matter of seconds. This allows you to act quickly to stop a bad run and restart without wasting hours or days.
Main Benefits of using ReportPortal
I've spoken with many experts on my Test Guild Automation Podcast and Automation Guild Conferences and here are the top benefits these testers point out.
1. Streamlined automation analysis: Report Portal's auto-analysis feature saves time by automatically categorizing failed tests based on historical data, reducing manual effort and speeding up the analysis process.
2. Improved failure investigation: With unique error analysis, Report Portal groups similar failures together, making it easier for teams to identify and investigate root causes of test failures.
3. Enhanced collaboration: Report Portal provides a centralized platform for tracking and managing test results, fostering better collaboration among QA team members and stakeholders.
4. Comprehensive data visualization: Configurable dashboards and widgets in Report Portal allow teams to visualize key metrics, identify trends, and gain valuable insights into their automation testing processes.
5. Seamless integration: Report Portal integrates with popular automation frameworks and CI/CD tools, enabling teams to incorporate it seamlessly into their existing workflows.
6. Detailed debugging information: The tool provides detailed logs and stack traces for each test case, making it easier for teams to debug and resolve issues quickly.
7. Historical data comparison: By storing historical test data, Report Portal enables teams to compare results over time, identify recurring issues, and make data-driven decisions to optimize their automation testing efforts.
8. Increased efficiency: With Report Portal, teams can reduce the time and effort spent on manual analysis, freeing up resources to focus on other critical tasks and ultimately improving overall efficiency.
By leveraging Report Portal, QA teams can significantly enhance their automation testing analysis and reporting capabilities, leading to faster issue resolution, better collaboration, and higher-quality software delivery.
Test Automation Triage Center
Report Portal was also created to act as a single point of entry for all test automation and results for your teams’ projects, making it an excellent center for both managers and test engineers.
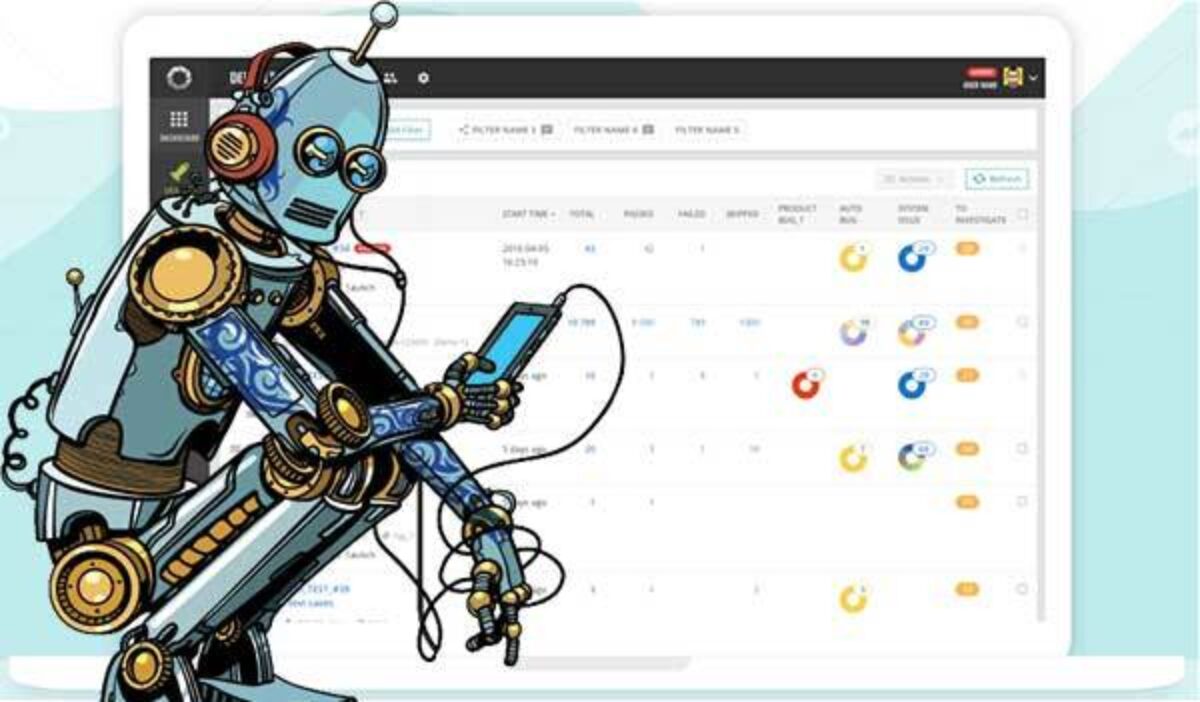
Classify Automation Test Failures
I also like the feature that allows for the classification of test failures, which means I can go in and set a failure as a defect, or mark it as a system issue.
Now anyone that logs in can scan and see which tests still need to be investigated.

In the Lunches section, test engineers can do their analysis as well as group and tag tests based on failure type. So all future runs and builds can tell you if in case you assigned or linked an issue in Jira or any other bug tracking integration.
You’ll see that the bug already exists.
It can also show, for example, whether it is open or closed, and you can also view all the comments.

AI Machine Learning
With the latest version of Report Portal, you can use machine-learning algorithms to help you to analyze your results automatically.
The machine learning algorithms use all the historical data that is already in the dashboard database for your project. That means it can analyze your latest execution, and you can be confident about the status of your test cases.
Get FREE Automation Testing Courses
Save Crazy Time
This is a huge time saver.
Dzmitry mentioned that with some projects, this feature reduced the analysis of failures up to 90% of the time—time the team previously spent on reporting and result analysis.
From my brief experience with it, I can already tell it’s going to save my teams a bunch of time. You can see everything about your test: history, logs, screenshots–
all in one place.
For managers, the dashboard contains all the statistics and pretty eye candy graphs you could want. You can set up an executive panel based on widgets that nicely shows any KPI metrics your company uses.
This all means that automation engineers can triage their tests quickly and easily, and managers can see the high-level KPIs that they crave–all in one place.
Report Portal is Easy to Customize
Making the tool customizable was a crucial goal for the team that developed Report Portal. Since their vision was to make it open-sourced, they designed it with this in mind from day one.
To achieve this, they built it using microservices architecture, which makes it easy to customize since you can put your own microservice in place using their APIs. Your microservice will work like any of the other built-in microservices.
To see all of the API possibilities in Report Portal, you can click your profile menu option and API from the drop-down to view the Swagger. That will describe the array of APIs available as well as all the methods, which are behind the portal.
Being able to make a request to these APIs also makes Report Portal able to integrate into your CI/CD pipeline and create triggers for different actions within tools like your CI systems.
How Extensible is Report Portal?
Want proof that Report Portal can handle almost any integration?
They actually have a working Silk Test integration!
Remember Silk Test from the 90s or early 2000s?
They have integrated it with the Silk Test agent, which allows Silk to send the old-school results inside the report portal. And since it’s open source, you can see all the code at the same time, which means you can change the code and contribute to the project.
Between the APIs and the fact that everything works through the HTTP channel, you can integrate any solution that triggers particular events. It's pretty easy, and in most cases, a lead engineer will only need to spend a few hours implementing the adapters from scratch.
What Automation Framework Integrations are Supported
However, it appears as though Report Portal already has a bunch of integrations available so chances are you won’t have to even worry about this. If they don’t have an integration with the framework I use (Serenity), it is easy to find on one Github.
Here are the supported out-of-the-box integrations:
• TestNG
• JUnit
• Cucumber-JVM (Java)
• ScalaTest
• Cucumber
• Node.js client
• NUnit
• Specflow
• SoapUI

Love it So Far
I’ll let you know more as I continue to implement Report Portal into my company’s enterprise environment. But from what I’ve seen so far, if you’re looking for an open-sourced dashboarding solution explicitly made for automation testing, you should consider giving this a try.
Check out my full interview with Dzmitry Humianiuk all about AI-powered Test Automation Dashboard with ReportPortal


Any comparison between ReportPortal and Allure reports?
Good question – I’ve only used ReportPortal, not Allure.
Hi Joe,
Do we need to provide labeled data for classification and If yes, then how labeling of the pattern is performed ?
Secondly, whats the approximate accuracy number on reportportal predicted models?
Thanks
Abhishek