About this DevOps Toolchain Episode:
Welcome to another episode of the DevOps Toolchain podcast! I'm your host, Joe Colantonio, and today, we have an exciting episode lined up for you. We're diving deep into the world of OpenTelemetry with Michael Haberman, a senior architect at SmartBear and a co-founder of Aspecto.
Michael brings over a decade of experience in software architecture and has been instrumental in transitioning successful tech companies from monolithic applications to microservices.
In this episode, we'll explore what OpenTelemetry is, how it supports the three pillars of observability (traces, metrics, and logs), and the latest updates in the project. Michael will not only share theoretical insights but also practical tips on the importance of profiling, pain points to watch out for, and the adoption of OpenTelemetry in the industry, empowering you to enhance your monitoring and observability strategies.
This episode is a must-listen if you want to enhance your monitoring and observability strategies, especially in complex, distributed systems like microservices. Plus, stick around for Michael's pro tips on implementing OpenTelemetry in your projects. Ready to uplift your DevOps game? Let's get started!
Also make sure to check out SmartBear's free guide on What is OpenTelemetry? A Straightforward Guide: https://testguild.me/opentelemguide
Try out SmartBear's Bugsnag for free, today. No credit card required. https://links.testguild.com/bugsnag
TestGuild DevOps Toolchain Exclusive Sponsor
SmartBear’s BugSnag: Get real-time data on real-user experiences – really.
Latency is the silent killer of apps. It’s frustrating for the user, and under the radar for you. It’s easily overlooked by standard error monitoring. But now SmartBear's BugSnag, an all-in-one observability solution, has its own performance monitoring feature: Real User Monitoring.
It detects and reports real-user performance data – in real time – so you can rapidly identify lags. Plus gives you the context to fix them.
Try out SmartBear's Bugsnag for free, today. No credit card required.
About Michael Haberman
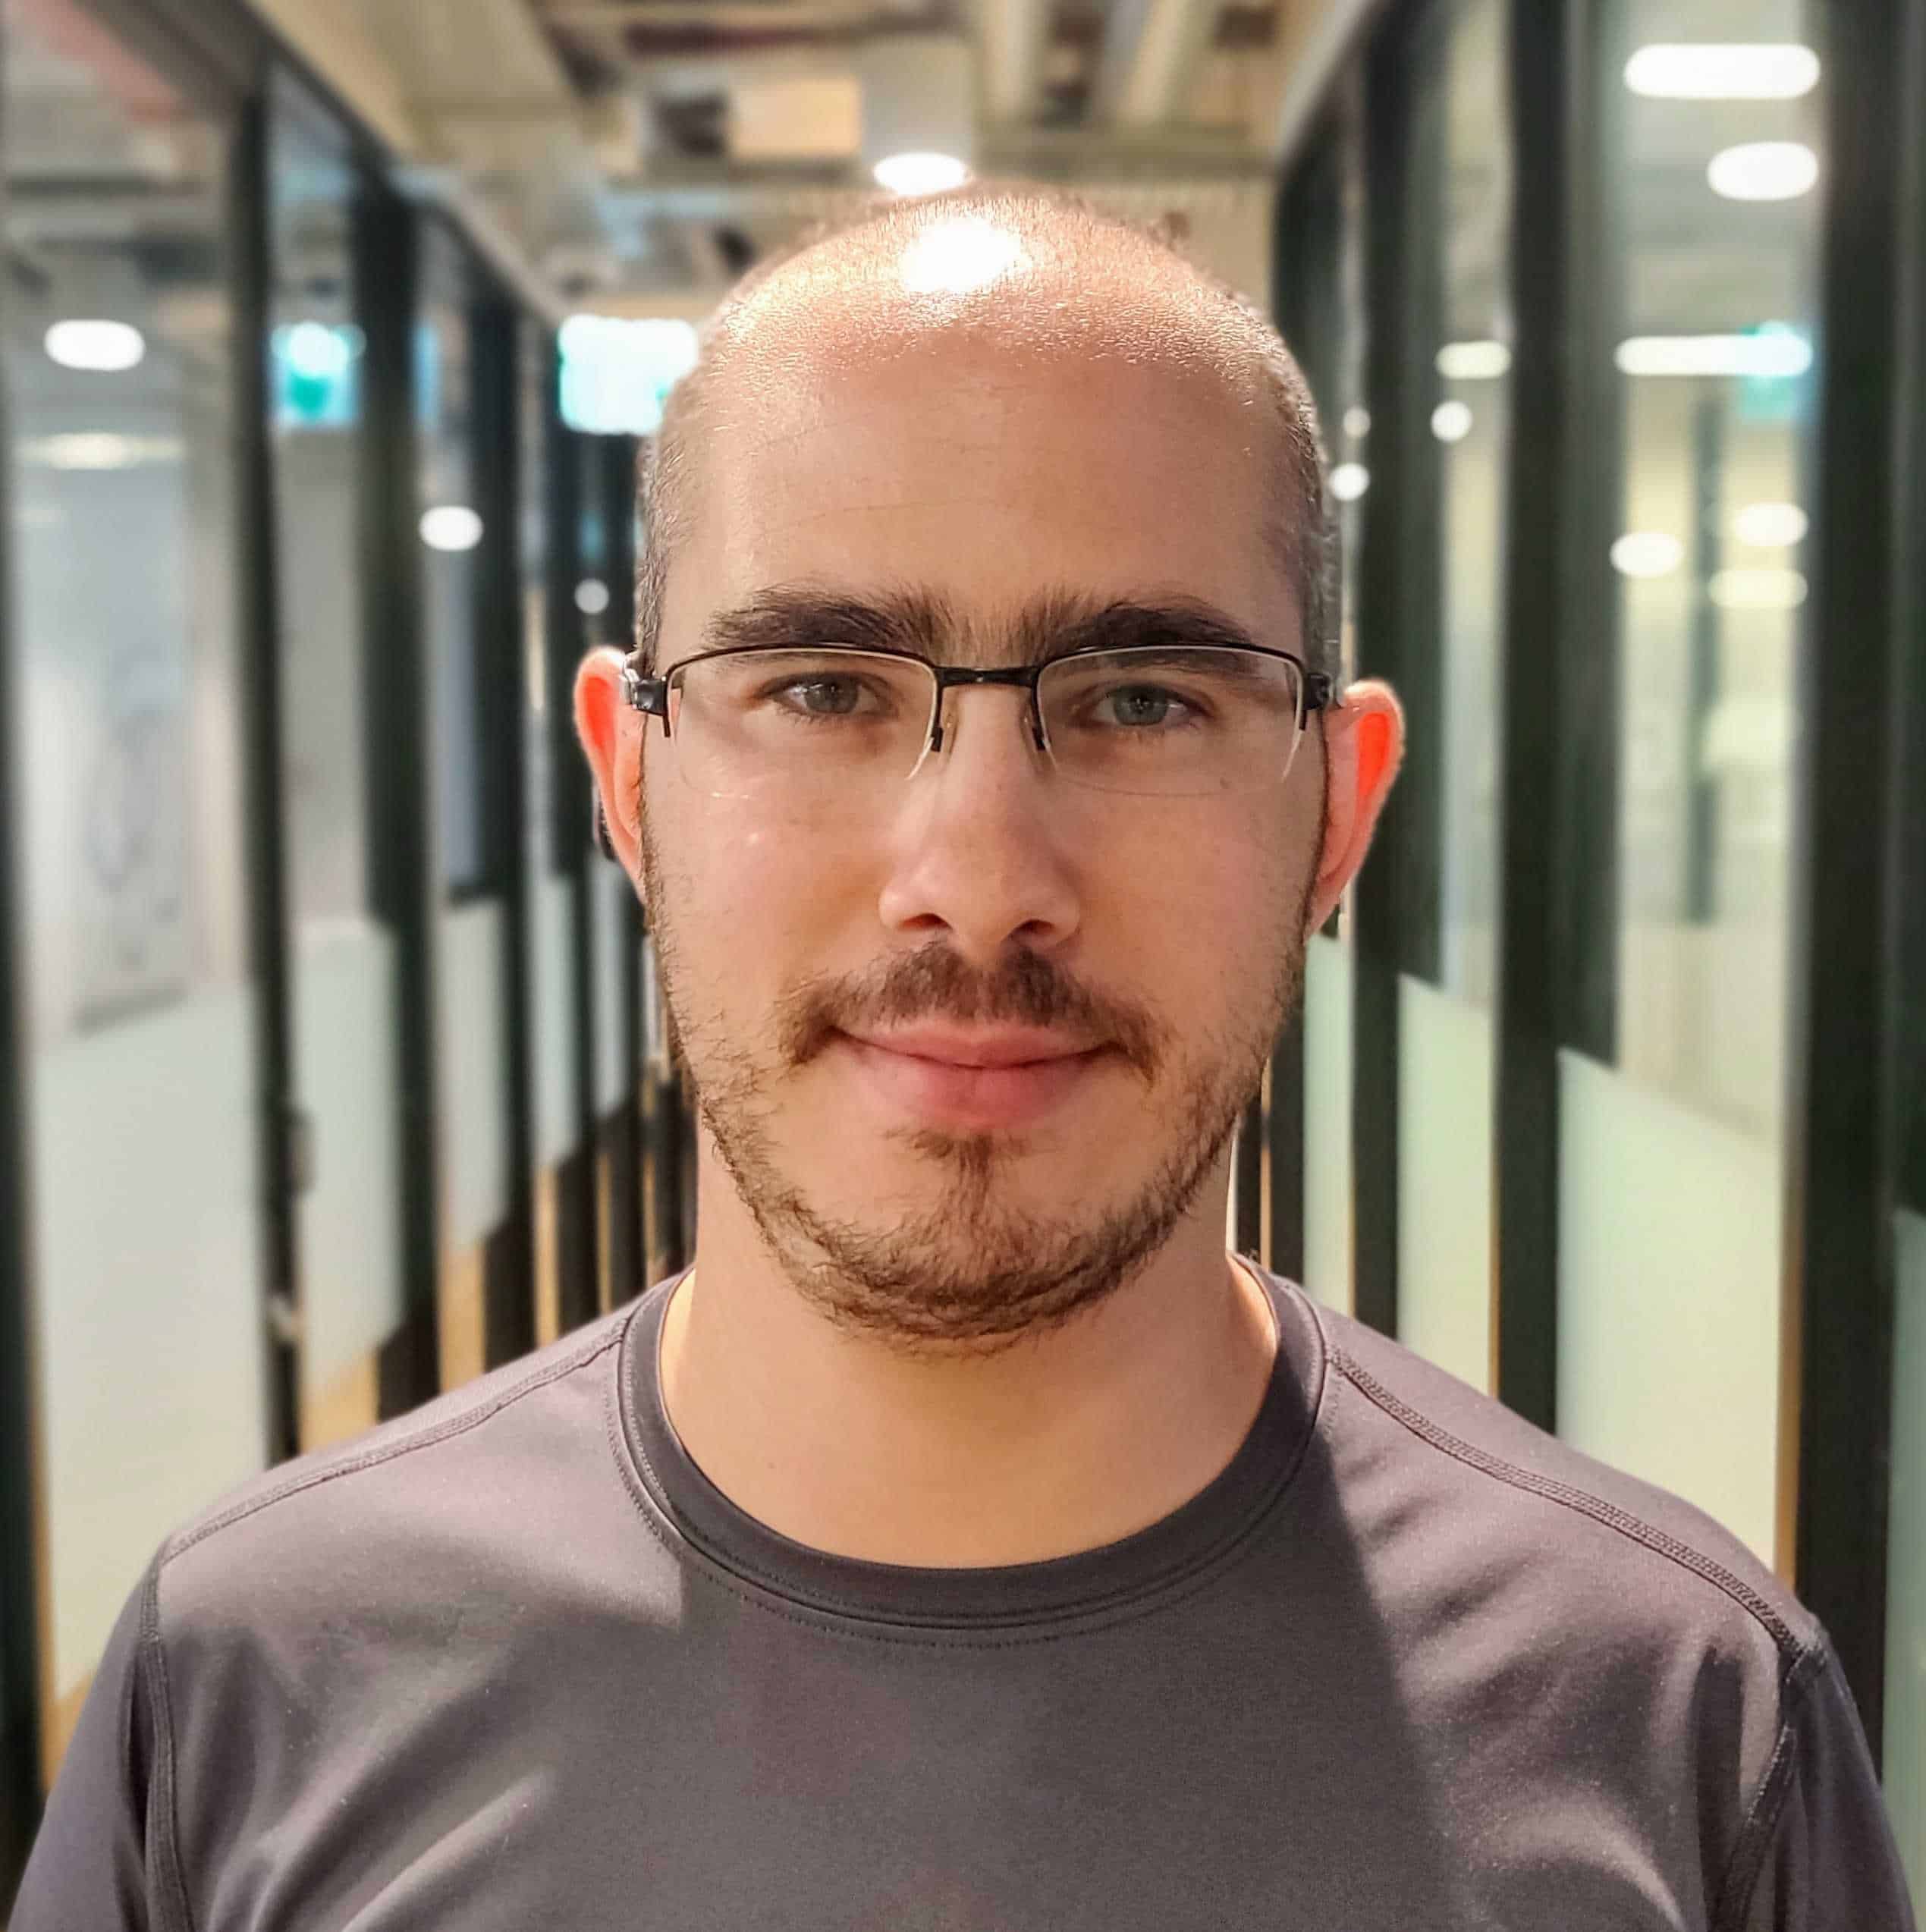
Michael is a Senior Architect at SmartBear, previously co-founder and CTO of Aspecto, a distributed-tracing platform acquired by the company. With over a decade of experience as a software architect, he has helped successful tech companies transition from monolithic applications to microservices. Michael’s expertise in managing microservice complexities has led him to develop solutions that simplify adoption and management. He enjoys sharing his insights and best practices with the tech community.
Connect with Michael Haberman
- Company: SmartBear
- Blog: www.michaelh
- LinkedIn: www.michael-haberman
Rate and Review TestGuild DevOps Toolchain Podcast
Thanks again for listening to the show. If it has helped you in any way, shape or form, please share it using the social media buttons you see on the page. Additionally, reviews for the podcast on iTunes are extremely helpful and greatly appreciated! They do matter in the rankings of the show and I read each and every one of them.
[00:00:01] Get ready to discover some of the most actionable DevOps techniques and tooling, including performance and reliability for some of the world's smartest engineers. Hey, I'm Joe Colantonio, host of the DevOps Toolchain Podcast and my goal is to help you create DevOps toolchain awesomeness.
[00:00:19] Hey, you want to know more about OpenTelemetry? Well, you're in for a treat because we'll be talking all about it today with Michael Haberman. If you don't know, Michael is a senior architect at SmartBear. He previously co-founded and was the CTO of Aspecto, which they distributed tracing platform acquired by SmartBear, I forgot how long ago. We'll find out, though. And he has over a decade of experience as a software architect. He has helped successful tech companies transition from monolithic applications to microservices. He knows his stuff. His expertise in managing microservices complexities, and has led him to develop solutions that simplify adoptions and management. All things that you need to know about, especially in this day and age in DevOps. Before we get into it, make sure also to download SmartBear's free. What is OpenTelemetry? A straightforward guide using the link down below.
[00:01:09] Joe Colantonio Hey Michael, welcome to The Guild.
[00:01:13] Michael Haberman Hey, Joe. Thank you. Thank you for having me.
[00:01:15] Joe Colantonio Awesome. Before we get into it, is there anything I missed in your bio that you want The Guild to know more about?
[00:01:20] Michael Haberman No, I think that covered it.
[00:01:22] Joe Colantonio Sweet. I think before we get into just in case, if anyone's listening, they don't even know what OpenTelemetry is. How would you explain what is OpenTelemetry?
[00:01:30] Michael Haberman OpenTelemetry is an open source project that defines how to collect telemetry data. At the core of it, it's a specification how the data should be collected. And on top of that you have implementation on how to actually collect it in different programing languages. So that's the core of OpenTelemetry.
[00:01:52] Joe Colantonio Nice. I think, I once heard this before. It's a kind of works alongside the three pillars of observabilit, traces, metrics, and logs. So can you explain how OpenTelemetry supports each of those pillars, maybe?
[00:02:05] Michael Haberman Yeah. Of course. So as I said, OpenTelemetry is all about collecting the data with telemetry data and OpenTelemetry initially set out to have three main telemetry types that would be traces, distributed traces, log, and metrics. Arguably, those are the ones that you must have in order to monitor and observe a cloud native application. So logs, they've been out there for the longest. I guess everybody knows what a stack. Basically, you write kind of the story within your code that then you can read and you understand what the application did. And then OpenTelemetry doesn't generate a lot of logs that usually actually the developers who write those and OpenTelemetry would send it to destination of your choice. Metrics, it tries to get a bit more interesting because OpenTelemetry can generate its own metrics. The OpenTelemetry is actually looking at the library is the framework that you use. So if you're using some REST framework and then it attaches to that framework and it would automatically create metrics such as how much HTTP calls did you get, there are latency breakdown for HTTP status code, those kind of things which you may had to do manually would OpenTelemetry you get that out of the box. And you can also have your own custom metrics. Looking at traces, distributed trace this is where OpenTelemetry started from. This is where it most mature. And traces are generally created automatically. Again, by attaching to the libraries that you use, it's able to create the traces.
[00:03:48] Joe Colantonio Nice. Now, I know a lot of companies. A lot of people have really started to embrace OpenTelemetry. I think it's gained a lot of traction since inception. So do you know any recent updates or milestones for the OpenTelemetry project that developers in general should be aware of?
[00:04:03] Michael Haberman Yeah, I think there are a few interesting things that are happening. First one is OpenTelemetry is expanding from the three core pillars. There's a new telemetry tie that is approved and starting to be developed, and that's called profiling. So you'll be able to profile code in production, and OpenTelemetry will go and have more and more telemetry types as the project matures. I think that's very interesting. Things are happening. Logs which GA few weeks ago or months ago, which is was really important because people need logs and it wasn't GA yet. So I think the interesting thing that's happening happens.
[00:04:48] Joe Colantonio What's the big deal about profiling, do you think?
[00:04:50] Michael Haberman What's the big deal? I'm not sure if it's a big deal or people had the OpenTelemetry really pushed the notion of all three pillars of observability. And what people concluded from that is that OpenTelemetry is going to be only about go three. And once we introduce the fourth to help with that the fourth pillar if you want, I think people start to understand that OpenTelemetry is looking to answer all the observability questions.
[00:05:21] Joe Colantonio I think with standards like OpenTelemetry, sometimes you cross your fingers and hope that it starts to get adopted as a standard. Any idea how that's going? How many vendors do you think are embracing it? Any thoughts on that?
[00:05:34] Michael Haberman So I think it's kind of became industry standard. You see all the monitoring vendors embraced OpenTelemetry. I think all of them can ingest OpenTelemetry data. So if you have some monitoring solution, most probably you can send the Telemetry data to it. Another very important sign is that the cloud vendor support it. So you can send your telemetry data to your cloud vendor. And it would know how to ingest that. And one very interesting thing that we start to see in the adoption is that code frameworks and code libraries are starting to produce telemetry data by themselves. So if OpenTelemetry had to go ahead and fetch each library that you use. Now, it's enough standard for the library themselves to implement OpenTelemetry within the library, which is a very important step.
[00:06:33] Joe Colantonio Nice. Now, I mentioned in the very beginning how Aspecto your company was acquired or moved over to SmartBear. Can you talk a little bit about Aspecto, and why do you think SmartBear made that move? Does it just show the importance of OpenTelemetry nowadays and what you all were trying to do at Aspecto?
[00:06:50] Michael Haberman Aspecto, though we were a very early adopters of OpenTelemetry in its early days, and we made a lot of contribution to the project. What we wanted to do is to help people get started with OpenTelemetry, and also address some of the pain points that OpenTelemetry has. And what's SmartBear saw in Aspecto was kind of that they wanted to have their own offering of OpenTelemetry and allowing bugs not only to be an error monitoring solution, but rather a performance solution. And they chose OpenTelemetry to do that.
[00:07:34] Joe Colantonio Nice. So speaking of pain points, then, I know how hard is it then to start implementing OpenTelemetry for your application? I think there's multiple ways, but any gotchas or things people need to watch out for or be aware of when they're trying to use OpenTelemetry?
[00:07:49] Michael Haberman Yeah, I think there are two things. The first thing that you have to do is to implement the OpenTelemetry SDK in the programing language that you use it. For the most part, this is a pretty straightforward things to do. Usually, you just import the library. It's running the initial function and should be working. One thing to remember usually you don't install it on one application. Usually your application is distributed. You will need to install in multiple places. The first time that you install, it's easy, but then if you have 50 services and you need to do one little change, you need to do it 50 times. Think on depending on your configuration. How you avoiding that? I don't know if you have a shed randomly or something of that sort. This is one thing to keep in mind. And a very interesting kind of side project of OpenTelemetry is the OpenTelemetry operator, which is a Kubernetes operator that you can run in your Kubernetes environment and in production inject OpenTelemetry to your containers without the need to install it manually in each application, which is a very easy way to implement OpenTelemetry. It doesn't support all the languages, but most of them.
[00:09:07] Joe Colantonio Nice. Is anything that people need be aware of when they're looking at the specification? Do they really need adhere to it as close as possible? And if not, will it create like compatibility or different issues with different visualization tools or anything like that?
[00:09:21] Michael Haberman I think the the end user of OpenTelemetry shouldn't be too concerned with the specification unless you're contributing code to OpenTelemetry. It's very important. And if you're a vendor, it's really important to follow the specification. So yeah, if you're just installing OpenTelemetry, you probably don't need to be aware of the specification. And I think most vendor are aligning on the specification quite well.
[00:09:48] Joe Colantonio For companies that have a lot of applications that exist already and they want to implement OpenTelemetry, it's an all big bang or nothing. Is there an incremental way you can adopt OpenTelemetry is like a like baby steps, maybe, or certain levels you can get at without just doing, throwing it all out there.
[00:10:04] Michael Haberman Yeah. So I wouldn't throw like a big bang deployment and hope for the best. I would pick some services that they feel comfortable on experimenting with. Better if they're communicating with one another. So we will be able to see distributed trace and then experiment with those gain confidence understanding different configurations that you may be required to do and then move forward to know everything.
[00:10:31] Joe Colantonio So I guess, are there any services or components that should be prioritized to instrument first? They can once they see it like oh wow, okay, I get it. Let's move forward.
[00:10:41] Michael Haberman Yeah. So you have to start with the OpenTelemetry SDK. That's the component running within your code. And then that component need to export the data somewhere. This somewhere could be some vendor or open source tools or an OpenTelemetry collector and OpenTelemetry collector, it's the backend component that can ingest, process and distribute the telemetry data whether you are going to run or not run the collector it's an important decision. It's decision that you can change, but it's important decision to think through. As a rule of thumb, I would say if you're a small company, you probably don't need that. Medium size may probably need that large company. You definitely need that.
[00:11:29] Joe Colantonio Gotcha! So I speak to a lot of people I know a lot of them are moving towards a microservice architecture. How does OpenTelemetry help or enable observability in those kind of really complex distributed systems? I guess it's a must haves, would you say, or like how does it help developers?
[00:11:46] Michael Haberman OpenTelemetry again, is the company that collects the data. So then you need to ask which data contributes to adopting a microservices. And for the most part, it's going to be distributed tracing. What distributed tracing allows you to do is to see how any interactions have started with one service, and then propagated throughout different services. You can see the entire interaction in one view. So if service A you call service B and then C, if you're looking at a trace, you will be able to see all of the interaction that occurred due to that usually API call. And this is something that you can't do with with metrics and with logs you can't do out-of-the-box. People may try to have like some correlation between different logs in order to understand the whole story, but to get that out of the box with traces and logs usually doesn't help with performance issue, and with cases this is inherent in the tracing data itself. So usually what the company that would implement microservices, they would usually would already have some monitoring solution. And if it doesn't have the tracing and they don't have enough service, they would start to ask, okay, which service is causing the problem? I know where I'm getting the effect, but what is the cause? And then they will start to look for the .... tracing and in OpenTelemetry get it out of the box.
[00:13:19] Joe Colantonio Nice. What's the future you see with OpenTelemetry I know AI has been big deal. What someone has OpenTelemetry. Is it a leap to think that eventually AI will know or I had an issue in production? I know exactly what the issue is because OpenTelemetry let me go ahead and fix there. Is that not even in the near future? Is that a even normal scenario you could foresee?
[00:13:40] Michael Haberman So OpenTelemetry has very strict limits on what it's going to do. It's going to collect the data, and it's going to be responsible on shipping the data to wherever you decide. It's not going to visualize the data, analyze the data, nothing of that sort. So OpenTelemetry is saying, I'm not going to interfere with what they are doing, whether it's a vendor, an open source tool, send the data, whatever they want. Once the data sent, it's out of our hands. Where do I see OpenTelemetry going in that aspect? I think mostly we're going to see more telemetry type supported such as evolves. We're going to see more support for client side observability, which is kind of lacking these days. Things goes with the others.
[00:14:33] Joe Colantonio Great. So I said you were one of the leaders of Aspecto. Now you got SmartBear. I know you've seen a lot of different organizations. Any success stories, you've seen how they implemented OpenTelemetry or seen how ways it's significantly improved their observability or application performance?
[00:14:52] Michael Haberman Yeah, 100%. So usually the success stories are around performance. You get this. We have a customer and that's usually the transaction as a specific transaction would take less than a second. And every now and then it would take like 40 seconds and usually for the larger customers. And the customer would complain. And then it logs. Then they tried over and over and over to find what happened. And then using Aspecto, they were able to capture the right trace, look at the trace, and then figure out what happened. It was a common pattern that's happening with microservices called N+1 query. You query one thing, it returns a list. Then you do something for each item in the list you expected the list to be short. But then the list is in the hundred and thousands. And then you get performance issues, which is exactly what they had.
[00:15:52] Joe Colantonio Nice. With Aspecto, on your roadmap, are you just waiting for OpenTelemetry to incorporate things or is there anything on your roadmap that you're building on top of OpenTelemetry that you see making it even better?
[00:16:07] Michael Haberman What we focus mostly was around, sampling. So we're talking about trace data. So you throw this SDK in your code and it's just starting to send out traces. You don't control how much tracing it's going to produce. And unlike logs where you both have the control. And also you have the velocity of the logs, whether it's an info or warning, or error. So you get a stream of data and you need to pay for that. And that could be too expensive to some, to some customer, to some companies. What we did is we implemented a mechanism where you can define the rules of what data interest you the most. So for instance, you can say if this trace had an error I want to sample 100% of the data. If this trace has latency, I want 100% of the data. These traces belong to this customer, which is very important for us, worked hard the sample data, but for all of the rest we want a baseline of 20%. So by that you can collect the data that's most interesting for you and then sample data for all the rest. And then you get the most and you don't need to pay for everything.
[00:17:25] Joe Colantonio Awesome. With OpenTelemetry, who normally benefits from it, I know everyone benefits it from, but the developers just help them debug quicker in production. Why should they all be embracing telemetry and especially OpenTelemetry?
[00:17:39] Michael Haberman I would say that OpenTelemetry is a new approach to something that existed for a long time. Eventually, we're talking about the monitoring space, everybody monitoring the application. We start to call it observability because things change a bit, but it's an evolution of monitoring. Cloud native and microservices created a different need to observe your application. But eventually it's kind of the same thing. With OpenTelemetry created, it created an open source, an open standard to collect the data, and with that allowing all of the monitoring vendor on the same thing. If you want to move today from your current vendor to a new vendor, you need very good incentive to do that because it's very complex. The SDK, the components that you have deployed are specific to one vendor. Moving to another vendor could be very, very complicated. Talking about OpenTelemetry, you have OpenTelemetry installed. Now choose where to send the data. If you want to move from vendor A to vendor B, it's the same data. You just need to point to a different address. And now you are using a new vendor. I think the motivation to use OpenTelemetry at the core of it is in an open standard, open source version of collecting monitoring data.
[00:19:09] Joe Colantonio Nice. This may be a dumb question. Are there any cons or downsides to OpenTelemetry or things that could be, I guess, not optimal. We're talking a lot of pros by any cons I guess.
[00:19:22] Michael Haberman Yeah, yeah, 100% everything comes a price. So OpenTelemetry is kind of a new project. It's on the road I think for four years now, something like that. If you look on the mature vendors and the monitoring space. Yeah, I don't know, 15 years. OpenTelemetry does have maturity issues in certain places. As I said, I think it was like two months ago logs which GA only know. The logs is very important piece of your application. I think the maturity both in the feature set that you get from OpenTelemetry, but also the documentation. In some instances it's lacking, making it harder to get started with.
[00:20:08] Joe Colantonio Awesome. Any resources or tutorials or learning materials you recommend to help, maybe a developer get started with OpenTelemetry.
[00:20:16] Michael Haberman Yeah. So first of all, OpenTelemetry has its own documentation, which is significantly better every few weeks. It's mostly for Get started things. It's very, very good. There are other online free courses or lectures that you can find. We at Aspecto created the OpenTelemetry bootcamp. It's a YouTube series of getting started from the simplest to more advanced stuff six hours in total, which is a very good place to start with.
[00:20:51] Joe Colantonio Nice, Okay, Michael, before we go Is there one piece of actionable advice you can give to someone to help them with their OpenTelemetry DevOps efforts? And what's the best way to find or contact you?
[00:21:00] Michael Haberman Best advice would be, I think, experiment with it. I think it's a very good piece of software that you get a lot from, and I think developers are usually hands on. Play with it, gain confidence and you have a very good monitoring solution in your hand. Best way to find me is in my email address michael.haberman@smartbear.com.
[00:21:27] And for links of everything of value we covered in this DevOps Toolchain Show. Head on over to TestGuild.com/p148 and while you're there make sure to click on the SmartBear link and learn all about SmartBear's awesome solutions to give you the visibility you need to deliver a great software that's smartbear.com. So that's it for this episode of the DevOps Toolchain show. I'm Joe, my mission is to help you succeed in creating end-to-end, full-stack DevOps toolchain awesomeness. As always, test everything and keep the good. Cheers.
[00:22:01] Hey, thanks again for listening. If you're not already part of our awesome community of 27,000 of the smartest testers, DevOps, and automation professionals in the world, we'd love to have you join the FAM at Testguild.com and if you're in the DevOps automation software testing space or you're a test tool provider and want to offer real-world value that can improve the skills or solve a problem for the Guild community. I love to hear from you head on over to testguild.info And let's make it happen.
Sign up to receive email updates
Enter your name and email address below and I'll send you periodic updates about the podcast.