Best Application Performance Monitoring Tools (APM)

Is this the year you start taking your application performance monitoring more seriously?
With Agile and DevOps practices, we’re delivering software to our customers faster than ever. But what happens once it’s in the hands of your users? Are they users experiencing poor performance?
Do you have any idea what the customers’ experience is? Are your users experiencing poor performance?
In today’s environment, the customer is king.
There are so many options that if your application is not meeting all their expectations, it’s likely they’ll drop you for a competitor and never look back.
This is where Application Performance Monitoring (APM) (also known as Application Performance Management APM) can help in both your data center and cloud-based applications.
In this guide, you’ll learn:
- What Application Performance Management (APM) is
- Why do you need to use the best APM tools
- List of the best FREE application for your APM needs
[ez-toc]
What is Application Performance Monitoring?
An APM solution provides insight into potential performance, bottleneck, and software availability issues with your software application you might not otherwise be aware of—until it’s too late. It can also help find issues in your infrastructure from your operating system, web service, application server, web server, etc.
By being proactive and monitoring all phases of your development pipeline (including production), you can find issues before your customers do.
APM solutions are almost like X-ray vision, allowing you to peer into what would normally be a black box activity and gather insights that can take your application quality to a higher level.
Why You Need Application Performance Monitoring Tools
Application Performance Monitoring tools enable you to:
- Speed up your development lifecycle
- Perform code audits
- Gain an understanding of which features are really being used by your customers.
- Understand application dependencies
- Uncover performance problems
- Increase your confidence in the software you release
- Monitor the impact of your code changes
- User experience monitoring. Sometimes this is known as Real User Monitoring (RUM)
- Network Monitoring and Network Performance
If you think about the nature of business in the 21st century, where we hear a lot of talk about the need to innovate, disruption, and blue chip companies going out of business more and more quickly, it’s no longer enough to say ‘we make Band-Aids, and we make the best Band-Aids in the world, and we’ve made them for 100 years, and let’s keep making Band-Aids better and better.’ One of the characteristics of post-industrialism is the need to shift your focus as a company from doing the same thing over and over again to doing new things on a continuous basis. In order to do new things and in order to know whether those new things are relevant, you need some kind of feedback mechanism.
—Jeff Sussna, author of Designing Delivery: Rethinking IT in the Digital Service Economy, and my guest on TestTalks Episode 68.
Using application performance monitoring to get the feedback Jeff talked about is essential. Of course, you will need an Application Performance Monitoring tool for this.
Best Application Performance Monitoring Tools You Need
There are many application performance monitoring tools available on the market from trusted vendors like New Relic and AppDynamics, and many of them offer scaled-down, free trial versions of their products.
If you look at the Gartner Magic Quadrant for Application Performance Monitoring report, all the tools listed are vendor tools like:
• Dynatrace
• New Relic APM
• Riverbed
• Tingyun
Although these APM tools are well worth the money—especially Dynatrace’s cool PurePath technology that Andres Grabner shared in the 2017 PerfGuild session—not everyone has the budget for these tools.
What if your team prefers open-source application performance management APM solutions instead?
Here are some of the more popular options according to Github. Regardless of whether you choose a vendor or open-source application for your APM needs, they all should provide you with:
- User experience monitoring
- Business transaction monitoring and tracking SLAs
- Infrastructure monitoring
- Performance data and response time monitoring
- The ability to do a deep dive into captured data
- Reporting, dashboarding, and analytics capabilities
Open Source Application Performance Monitoring Tools List
1. Pinpoint

The most popular Application Performance Management tool currently in Github is Pinpoint. Designed for large-scale distributed systems written in Java and PHP, Pinpoint is an excellent option for enterprise companies. Pinpoint gives you the ability to analyze the structure of your system and how your components are interconnected using their tracing technology.
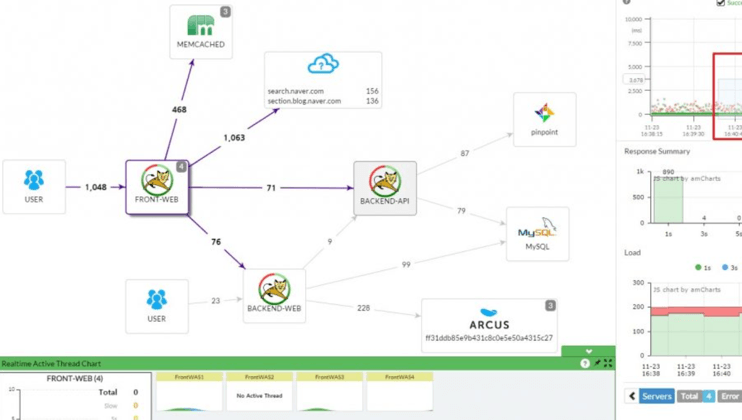
Pinpoint’s website highlights the top benefits of their solution:
- The ability to quickly understand your application topology
- Monitor your application in real-time
- Get code-level visibility into all your business-critical transactions
- APM agent installs without changing any code
Pinpoint currently has 7.8 Github stars.
2. Apache SkyWalking

SkyWalking is an Application Performance Monitoring solution that is perfect for teams work with Microservices, cloud-native and container-based (Docker, Kubernetes, Mesos) architectures.
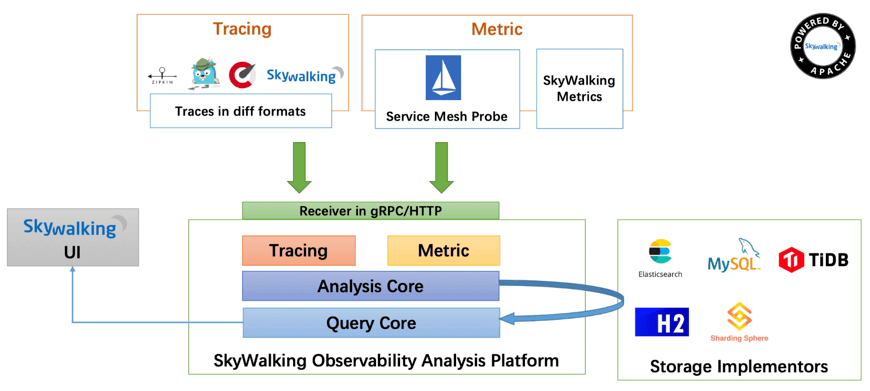
According to the Apache website, some of its main features are:
• Service, service instance, and endpoint metrics analysis
• Root cause analysis
• Service topology map analysis
• Service, service instance, and endpoint dependency analysis
• Slow services and endpoints detected
• Performance optimization
• Distributed tracing and context propagation
• Alarm
SkyWalking currently has 5.5k Github stars.
3. JavaMelody

If you need a comprehensive monitoring solution for JavaEE applications, check out JavaMelody.
JavaMelody was developed to monitor Java or Java EE applications in QA and production environments.
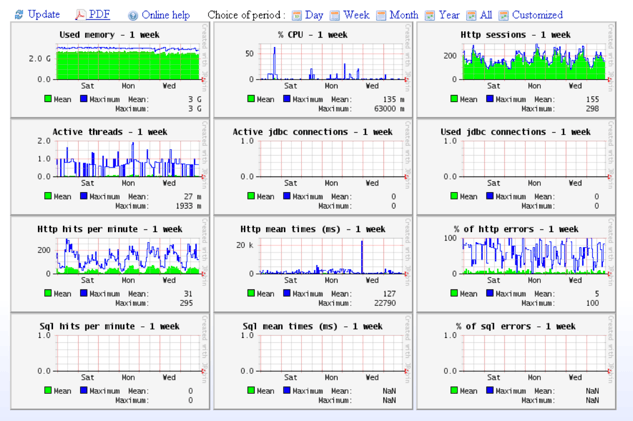
It’s a tool that allows you to effectively measure and calculate statistics on the real operation of your application depending on its usage.
It also integrates nicely with Jenkins and can provide you with charts for information like memory, CPU, system load, head dumps, and so on.
JavaMelody currently has 1.7k Github stars.

4. Stagemonitor

For monitoring applications manager performance of Java server applications, Stagemonitor might be what you’re looking for.
Stagemonitor comes with a bunch of tools to help with the development, testing, production, and performance monitoring of your Java-based web applications. It also has a monitoring agent built with support for clustered application stacks.
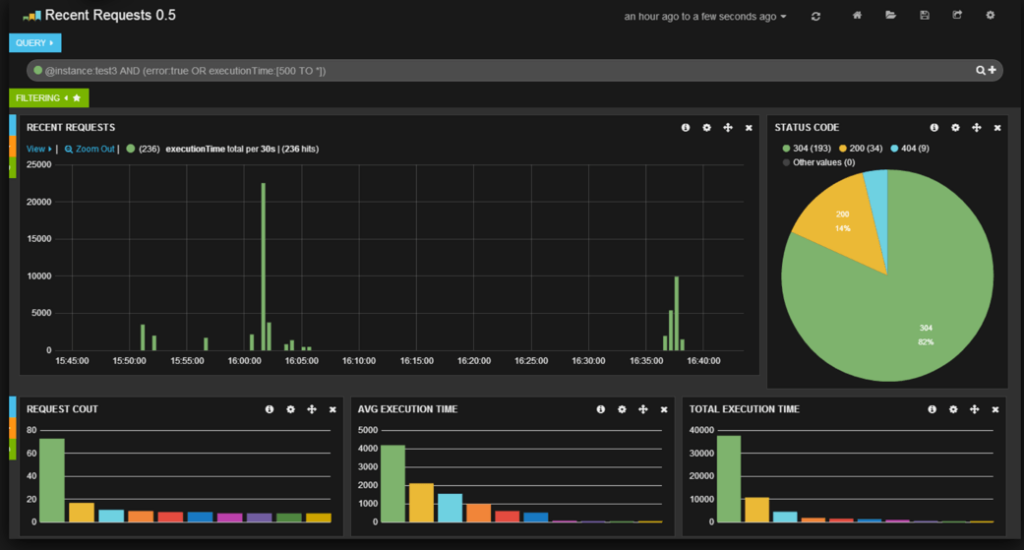
Some of its key features are:
• In-browser widget
• Analyze requests using the Kibana dashboard
• Cluster Monitoring Capabilities —get the metrics of your whole cluster
• Supports creating new plugins
Stagemonitor currently has 1.4k Github stars.
5. Scouter

Scouter describes itself as an open-source Application Performance Monitoring solution similar to New Relic APM and AppDynamics.
Scouter has the functionality to monitor targets like:
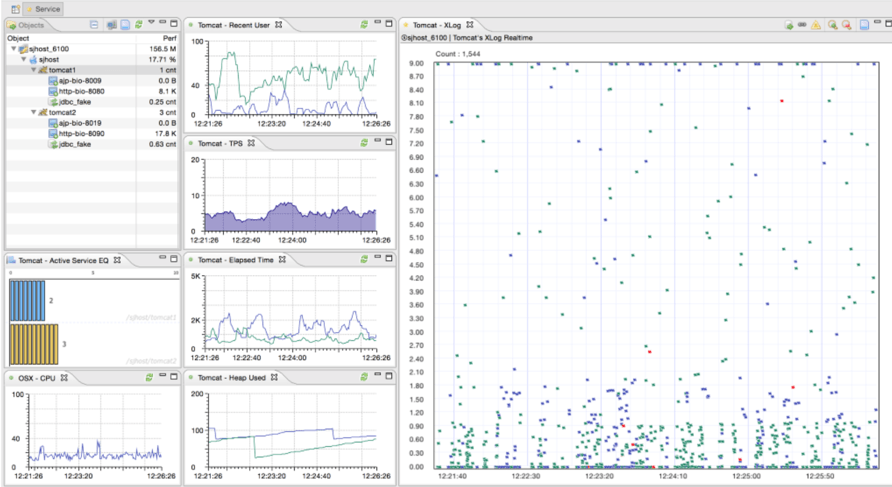
- Java agent for Web applications
- Redis, NginX, MongoDB, RabbitMQ and Elasticsearch
- Zipkin
It also shows you performance metrics like:
- User activity
- Service activity, including TPS, response time, SQL profiling, etc.
- Resource metrics for CPU, memory, heap
Scouter currently has 1.2k Github stars.
6. App Metrics
App Metrics, open-sourced by IBM, provides a foundational infrastructure for collecting resource and performance monitoring data for Node.js-based JavaScript applications. It has built-in support for:
• CPU profiling
• Average response times
• CPU, memory, heap monitoring, and much more
App Metrics currently has 547 Github stars.
7. Codespeed
If you’re into Python, Codespeed is a Web application that allows you to monitor and analyze the performance issues of your code.
Codespeed currently has 439 Github stars.
8. GoAppMonitor

Even Golang development shops can hop on the APM fun train with GoAppMonitor. GoAppMonitor is a Golang application for monitoring performance data.
According to GitHub, GoAppMonitor is “a library which provides a monitor on your Golang applications. It contains system-level-based monitoring and business-level monitoring (custom monitoring). Just add the repository into your apps and register what you want to monitor.”
GoAppMonitor currently has 400 Github stars.
9. App Perf
Although App_Perf is still in the early stages of development, it aims to provide an open-source solution that has similar functionality to vendor tools like NewRelic, AppNeta, SkyLIGHT, etc.
App Perf currently has 247 Github stars
10. inspectIT Ocelot
Just found inspectIT Ocelot, which is a zero-configuration Java agent for dynamically collecting application performance, tracing, and behavior data based on the OpenCensus library. The inspectIT Ocelot Java agent collects a lot of different data, namely metrics, and traces. What’s cool is that you can take this data and feed the data to be visualized using something like the Grafana Service Graph Panel.
Currently, it has 102 Github stars
Application Performance Monitoring and Automation Testing
Not only does Application Performance Monitoring data help you to be more proactive with customers, but it also can help you create better-automated tests. Having some targeted tests can help you catch issues before a change even gets into production.
Oren Rubin, founder of testim.io mentioned in his session at the 2018 AI Summit Guild that:
“Currently, there’s no connection between production and your test. I talk to hundreds of companies every year, and almost nobody actually goes on your Google analytics or APM analytics and sees what the coverage is…. but I think [that] if you put an app in production, you can learn a lot from that, and you can create tests from that data.”
Make this the Year for Application Performance Monitoring Awesomeness
With every year that goes by, as more teams adopt CI/CD practices, the need for a better, more effective APM plan is critical to your success. Don’t ignore it. Get some high-level monitoring in place now and start learning from your data.

Interested in learning more about Performance Testing
Join us for the 2nd annual online conference dedicated 100% to performance testing — PerfGuild. Taking place April 8-9 2019.
Register [now]

Joe Colantonio is the founder of TestGuild, an industry-leading platform for automation testing and software testing tools. With over 25 years of hands-on experience, he has worked with top enterprise companies, helped develop early test automation tools and frameworks, and runs the largest online automation testing conference, Automation Guild.
Joe is also the author of Automation Awesomeness: 260 Actionable Affirmations To Improve Your QA & Automation Testing Skills and the host of the TestGuild podcast, which he has released weekly since 2014, making it the longest-running podcast dedicated to automation testing. Over the years, he has interviewed top thought leaders in DevOps, AI-driven test automation, and software quality, shaping the conversation in the industry.
With a reach of over 400,000 across his YouTube channel, LinkedIn, email list, and other social channels, Joe’s insights impact thousands of testers and engineers worldwide.
He has worked with some of the top companies in software testing and automation, including Tricentis, Keysight, Applitools, and BrowserStack, as sponsors and partners, helping them connect with the right audience in the automation testing space.
Follow him on LinkedIn or check out more at TestGuild.com.
Related Posts

I’ve talked to a lot of people who claim their tool does “agentic testing.” Most of the time it’s a […]

What is Model Context Protocol (MCP) Model Context Protocol (MCP) is an open standard that lets AI agents — Cursor, […]
Look, I’ll be straight with you. I’ve been vibe coding in Cursor for about a year and a half, and […]

Here’s the thing about API testing tools: the list has exploded. What used to be “Postman or SoapUI?” is now […]