This week it was an honor to have on my TestTalks podcast Eric Lawrence, the creator of Fiddler. For those of you that aren't aware, Fiddler is a tool that allows you to monitor, manipulate and reuse HTTP requests. Fiddler does many things that allow you to debug website issues, and with one of its many extensions, you can accomplish even more.
What You Can Use Fiddler to Debug
Some things you might want to use Fiddler for:
- Troubleshooting issues with your web application
- Security testing
- Performance evaluations
- Debugging web traffic from most computers and devices
Let's take a look at how to install Fiddler and also review some of its keys features. (For more Fiddler awesomeness, be sure to check out my TestTalks interview with Eric in episode 31.)
Let's install Fiddler and take it for a quick spin.
To Install Fiddler
- Navigate to http://www.telerik.com/fiddler
- Select the Free download button.
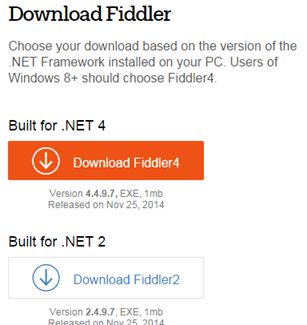
- Choose the version you want to install. I'm going with the .NET 4 version.
- Once Fiddler is downloaded, double click on the fiddler4-setup.exe
- Take the install defaults.
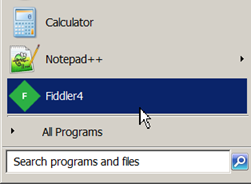
- If Fiddler has installed correctly, you should have an option for Fiddler4 in your start> programs section.
Fiddler Overview
When you first start Fiddler you might be a bit overwhelmed with all the available options. Let's take a look at some of the main UI sections for Fiddler to help you get more familiar with the different views.
I want to show you the top five areas that I think are the most commonly used: Web Sessions, Session Inspector, Static Tab, Composer, and FiddlerScript.
Web Sessions List
On the left-hand side, you have the Web Sessions List area. This contains any web session/HTTP proxy information captured by Fiddler along with some brief summary information for each session.
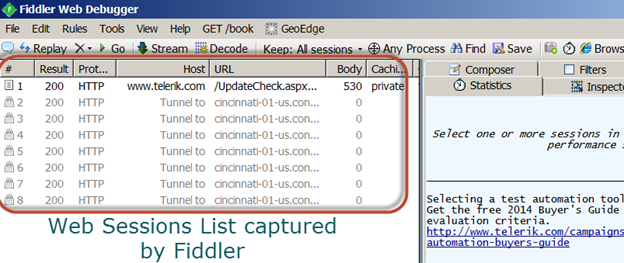
- With Fiddler running, open a browser and navigate to: https://testguild.com/SeleniumTestPage.html
- Under the Web Session list, find the SeleniumTestPage session.
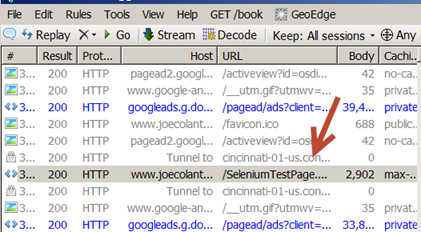
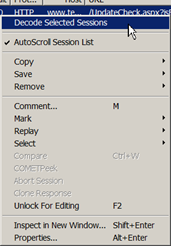
Right clicking on a session or group of sessions allows you to do many things, including:
- Mark a session to easily identify it
- Comment on a session
- Check a session's properties
- Save
- Compare the differences between two sessions
Double-clicking on a session allows you to view session-specific information under the Session Inspector.
Session Inspector
The Session Inspector tab will show you details for that web session info, including the request and response that was made. This makes it easy to monitor requests that are being sent to the browser. What's really cool is that because Fiddler acts as a proxy, it shows you exactly what is being sent back and forth from your application.
This information can help you debug issues with your application, and can also be used for security testing to see if there are things being exposed that an attacker could make use of.
There is a great PluralSight course by Troy Hunt called Hack Yourself First that reviews all the ways in which an attacker can compromise your application, and how a tool like Fiddler can help you find those issues.
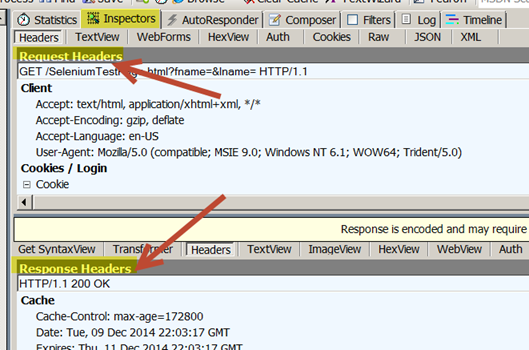
Also notice that — depending on the tab that you are on — that there are many more options. For example, the Inspector tab has a whole bunch of other options you can choose, such as Headers, TextView, Raw etc.
Fiddler Statistics Tab
To the left of the Inspector's tab you will see the Statistic tab.
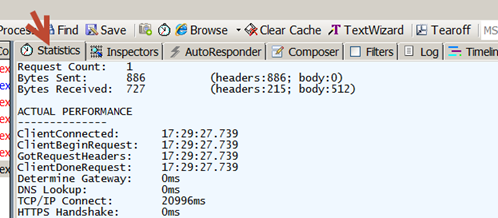
This tab allows you to view the number of requests and information about them. Selecting multiple sessions under the Web Session list allows you to see statistics for multiple sessions aggregated together.
Thanks to all of the information available in the Statistics area, it's a great place to start in order to profile the performance of your website. For example:
- Navigate to http://www.testtalks.com
- Highlight all the sessions
- Look at the Statistics tab
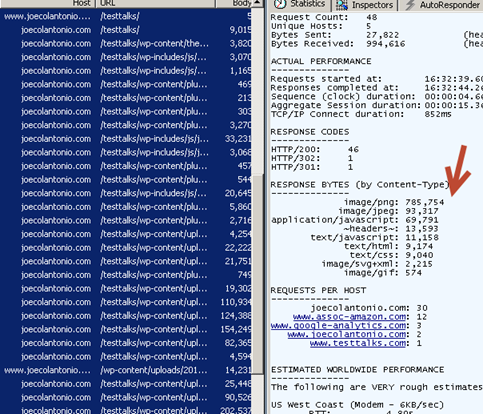
You should see things, like how many requests were made (48), who made the requests, the response code returned forty six HTTP 200 responses, meaning everything was fine. If I had bad requests, like 404 errors, they would appear here.
Furthermore, you can quickly see that the majority of wait time for this page to load is due to the images. I should consider reducing the image sizes or format to reduce the amount of time it takes for TestTalks to load.
At the bottom of this tab there is also a Show Chart option that visually breaks down the request. This make is easier to see that in my case it is the .PNG format that is causing the longest amount of wait time for www.TestTalks.com.
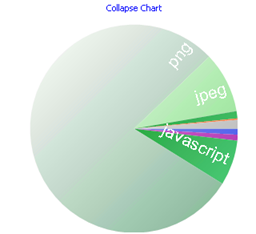
As you can see, this view can be used as a quick way to evaluate any website's high-level performance/health.
Another really handy tab that is the Composer tab.
Fiddler Composer
The Composer tab is well-named because it allows you, in a sense, to manually create (aka compose), modify and send HTTP requests. You can also take an existing web session and drag it into the Composer tab copy and Fiddler will reconstruct that request in its entirety, after which you can execute it.
This is really useful, because it means you can change things like User agents and see if your site responds differently based on that information.
- Highlight the www.testtalks.com web session.
- Drag it into the Composer tab.

The machine I'm running Fiddler on is a windows machine. What would happen if we were to change the agent to make the website think the request is coming from a Mac using Prism?
- Change to User-Agent to:
Mozilla/5.0 (Macintosh; U; Intel Mac OS X 10.6; en-US; rv:1.9.2.3) Gecko/20100402 Prism/1.0b4
- Click on the Execute button.
- Click on the new web session that you just executed.
- Under Headers, notice how it sent the modified User-Agent information we added:
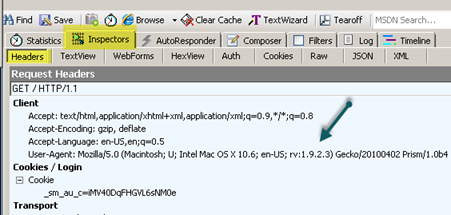
How cool is that!?! We just fooled our website into thinking it was receiving a request from a totally different OS and Browser configuration.
If you really want to modify a request, you can do all kinds of cool things using the FiddlerScript tab.
Fiddler Script
The power of Fiddler script is its extensibility. If you need to do something that isn't available out of the box, you can easily modify Fiddler to perform the functionality you need. One way to do this is to make use of FiddlerScript.
FiddlerScript allows you to incorporate rules into a script that can modify a request or response at runtime.
With Fiddler you can modify the session-handling functions, like OnPeekAtResponseHeaders (). This method is called before the response headers are sent to the client and before the body is read from the server.
Let's take a look at a simple example on how to use this.
- In Fiddler, click on the menu option Rule>Custom Rules
- If you prompted to install a Fiddler editor, do so now. (You can also just modify in Notepad.)
- Under the function OnPeekAtResponseHeaders(), add the following code:
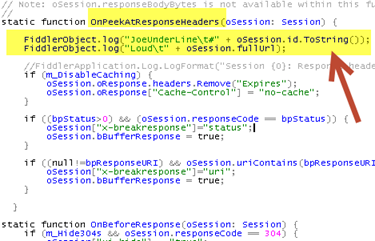
- Navigate back to www.testtalks.com
- In Fiddler, click on the Log tab.
- You should now see the custom message we added:
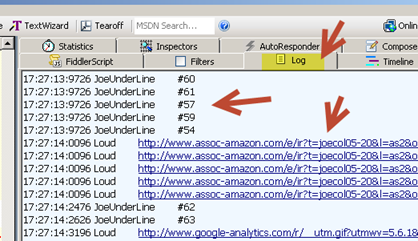
Once you've gotten started with Fiddler you'll start to see all kinds of different uses for it.
More Fiddler Getting Started Info
For more Fiddler information, be sure to listen to Eric Lawrence talk all things Fiddler-related on episode 31 of TestTalks. Eric has also has written a book called Debugging with Fiddler that you can grab on Amazon.
Besides the free getting started video on Fiddler, Pluralsight also has a few Fiddler-related courses available:
- Fiddler by Robert Boedigheimer
- Hack Yourself First: How to go on the Cyber-Offense by Troy Hunt
- Debugging the Web with FireBug, WebDeveloper, and Fiddler by Shawn Wildermuth


Hi Joe. Thanks for the great interview. I totally agree that one of the premium Fiddler benefits is its extensibility described by Eric. It creates synergy between core Fiddler features and various plugins. Here’s an example that I am familiar with firsthand. Our load testing tool called StresStimulus is available in two flavors, a standalone version, and a Fiddler plug-in. Unlike other tools, it allows to conduct low-level debugging of performance issues exposed during a load test. This makes it easier to pinpoint performance bottlenecks. StresStimulus is a commercial tool, but it has a limited free edition that works with up to 250 VUs.
Cheers.
Hey Joe. I like this post a lot. Fiddler is such a cool and useful tool. I am looking to become better with it so I appreciate this article. Keep up the awesome work man!